Sector Detector: Holiday fever takes hold of stock investors, but a pullback is needed
With warmer weather arriving to melt the early snowfall across much of the country, investors seem to be catching a severe case of holiday fever and positioning themselves for the seasonally bullish time of the year. And to give an added boost, both Europe and Asia provided more fuel for the bull’s fire last week with stimulus announcements, particularly China’s interest rate cut. Yes, all systems are go for U.S. equities as there really is no other game in town. But nothing goes up in a straight line, not even during the holidays, so a near-term market pullback would be a healthy way to prevent a steeper correction in January.
In this weekly update, I give my view of the current market environment, offer a technical analysis of the S&P 500 chart, review our weekly fundamentals-based SectorCast rankings of the ten U.S. business sectors, and then offer up some actionable trading ideas, including a sector rotation strategy using ETFs and an enhanced version using top-ranked stocks from the top-ranked sectors.
Market overview:
Last Friday brought a very nice opening pop to U.S. markets when China decided to cut its lending rate, making U.S. assets more attractive to global investors. Moreover, the ECB indicated its willingness to implement greater stimulus measures, including government bond purchases. Japan has slipped into recession with GDP decreasing by -1.6% in Q3 versus expectations of +2.2%. And Germany only expanded by a paltry +0.1%. The euro fell to near 2-year lows versus the U.S. dollar, while the yen fell to new 7-year lows against the dollar.
The combination of economic weakness in these major global economies and increasing U.S. oil production continues to push down the price of oil, and the resulting wealth effect of rising equity prices and low gasoline prices is expected to create a boon for retailers this holiday season. Adding to the seasonal strength for stocks is that corporations tend to do much of their buybacks this time of the year. Also, elevated short interest can provide yet another short-term catalyst.
M&A activity is another catalyst, and last week Allergan (AGN) and Actavis plc (ACT) both rose when ACT agreed to pay about $66 billion for AGN. Also, Halliburton (HAL) announced its acquisition of Baker Hughes (BHI). All four of these companies have been Sabrient favorites and reside in several of our model portfolios.
Among the ten U.S. business sectors, Healthcare, Utilities, and Technology are the clear leaders year-to-date, but all sectors are positive except for Energy, which continues to suffer from falling oil prices.
The 10-year U.S. Treasury bond yield closed Friday at 2.32%, and the CBOE Market Volatility Index (VIX), a.k.a. fear gauge, closed at 12.90, as it continues its decent into complacency. With bulls in control of the market, VIX remains firmly below the important 15 threshold.
SPY chart review:
The SPDR S&P 500 Trust (SPY) closed Friday at 206.68, and in the process it hit new 52-week intraday and closing highs. So much for the backing and filling I anticipated given the market’s overbought conditions. Apparently, there was no further need to consolidate that big run off the October V-bottom for fear of missing out on the year-end rally. However, the overbought technical condition have not abated, as oscillators RSI, MACD, and Slow Stochastic all remain overbought and really need to cycle back down soon. In addition, SPY now finds itself up against long-standing resistance from the long-standing rising bullish channel.
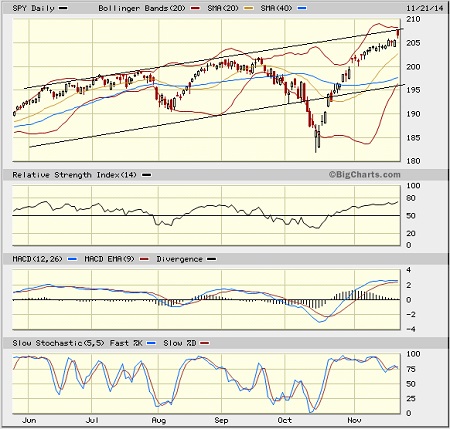
Other concerns include the Russell 2000 small cap index, which is struggling to keep up with the big caps, and will have to contend with strong resistance at the 1200 level. Also, the NYSE advance/decline line has not confirmed the rise in the major indexes. So, although a confirmed breakout of the SPY is possible at this level, the more likely (and preferable) scenario is a retest of support levels, some back-and-filling, and a working off of the overbought conditions -- otherwise, I’m afraid we will see a more drastic pullback come January. For my money, I’d rather see a small pullback in December than a major one in January.
Latest sector rankings:
Relative sector rankings are based on our proprietary SectorCast model, which builds a composite profile of each equity ETF based on bottom-up aggregate scoring of the constituent stocks. The Outlook Score employs a forward-looking, fundamentals-based multifactor algorithm considering forward valuation, historical and projected earnings growth, the dynamics of Wall Street analysts’ consensus earnings estimates and recent revisions (up or down), quality and sustainability of reported earnings (forensic accounting), and various return ratios. It helps us predict relative performance over the next 1-3 months.
In addition, SectorCast computes a Bull Score and Bear Score for each ETF based on recent price behavior of the constituent stocks on particularly strong and weak market days. High Bull score indicates that stocks within the ETF recently have tended toward relative outperformance when the market is strong, while a high Bear score indicates that stocks within the ETF have tended to hold up relatively well (i.e., safe havens) when the market is weak.
Outlook score is forward-looking while Bull and Bear are backward-looking. As a group, these three scores can be helpful for positioning a portfolio for a given set of anticipated market conditions. Of course, each ETF holds a unique portfolio of stocks and position weights, so the sectors represented will score differently depending upon which set of ETFs is used. We use the iShares that represent the ten major U.S. business sectors: Financial (IYF), Technology (IYW), Industrial (IYJ), Healthcare (IYH), Consumer Goods (IYK), Consumer Services (IYC), Energy (IYE), Basic Materials (IYM), Telecommunications (IYZ), and Utilities (IDU). Whereas the Select Sector SPDRs only contain stocks from the S&P 500, I prefer the iShares for their larger universe and broader diversity. Fidelity also offers a group of sector ETFs with an even larger number of constituents in each.
Here are some of my observations on this week’s scores:
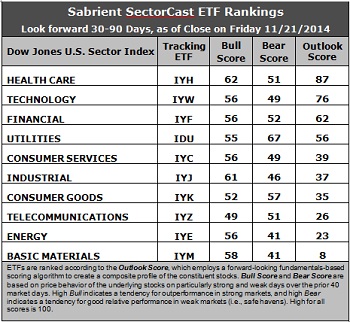
1. Not much change this week. Healthcare retains the top spot with an Outlook score of 87. Stocks within this sector continue to see the strongest net positive revisions to earnings estimates from sell-side analysts. Healthcare also displays a strong forward long-term growth rate, solid insider sentiment (buying activity), and good return ratios -- although the forward P/E is on the high side. Technology is in second place with a score of 76. Although Tech stocks continue to get hit with downward earnings revisions, they display the best return ratios and a good forward long-term growth rate. Financial remains in third with a score of 62, and it still boasts the lowest (most attractive) forward P/E. Rounding out the top five are Utilities and Consumer Services/Discretionary (a.k.a., Cyclicals).
2. Energy and Basic Materials continue to be hit with negative earnings revisions from Wall Street. As a result, Basic Materials remains in the bottom of the Outlook rankings this week. The sector also displays low insider buying activity and poor return ratios. Energy remains in the bottom two, even though its forward P/E is attractive.
3. Looking at the Bull scores, Healthcare displays the highest score of 62, followed by Industrial. Telecom scores the lowest at 49. The top-bottom spread is 13 points, reflecting high sector correlations during particularly strong market days, i.e., highly correlated risk-on behavior. It is generally desirable in a healthy market to see low correlations and a top-bottom spread of at least 20 points, which indicates that investors have clear preferences in the stocks they want to hold, rather than the all-boats-lifted-in-a-rising-tide (risk-on) mentality that dominated 2013.
4. Looking at the Bear scores, Utilities again displays the highest score with a robust 67 this week, as one would expect for this traditionally defensive sector. Utilities stocks have been the preferred safe havens on weak market days. Energy and Materials display the lowest score of 41. The top-bottom spread is 26 points, which continues to reflect low sector correlations on particularly weak market days. Again, it is generally desirable in a healthy market to see low correlations and a top-bottom spread of at least 20 points. Also displaying a strong Bear score of 57 is Consumer Goods/Staples (a.k.a., Non-cyclicals), which along with Utilities are traditionally defensive sectors that would be expected to have the highest Bear scores in a healthy market.
5. Healthcare displays the best all-around combination of Outlook/Bull/Bear scores, while Basic Materials is the worst. Looking at just the Bull/Bear combination, Utilities is the leader, followed by Healthcare, indicating superior relative performance (on average) in extreme market conditions (whether bullish or bearish). Energy is still the worst, although Materials and Telecom are close behind, indicating general investor avoidance during extreme conditions.
6. Overall, this week’s fundamentals-based Outlook rankings still appear slightly bullish to me, despite the downward earnings revisions in most sectors. Five of the top six sectors are economically-sensitive (or in the case of Healthcare, all-weather), and they also display some of the highest Bull scores. Keep in mind, the Outlook Rank does not include timing or momentum factors, but rather is a reflection of the fundamental expectations of individual stocks aggregated by sector.
Stock and ETF Ideas:
Our Sector Rotation model, which appropriately weights Outlook, Bull, and Bear scores in accordance with the overall market’s prevailing trend (bullish, neutral, or defensive), continues to indicate a bullish bias this week, and it suggests holding Healthcare, Industrial, and Technology (in that order, for those portfolios that might be due for rebalance). (Note: In this model, we consider the bias to be bullish from a rules-based trend-following standpoint because SPY is above both its 50-day and 200-day simple moving averages.)
Other highly-ranked ETFs from the Healthcare, Industrial, and Technology sectors include Market Vectors Biotech ETF (BBH), SPDR S&P Transportation ETF Trust (XTN), and iShares PHLX Semiconductor ETF (SOXX).
For an enhanced sector portfolio that enlists some top-ranked stocks (instead of ETFs) from within the top-ranked sectors, some long ideas from Healthcare, Industrial, and Technology sectors include Amgen (AMGN), Celgene (CELG), United Parcel Service (UPS), Landstar System (LSTR), Intel (INTC), and Texas Instruments (TXN). All are highly ranked in the Sabrient Ratings Algorithm and also score within the top two quintiles (lowest accounting-related risk) of our Earnings Quality Rank (a.k.a., EQR), a pure accounting-based risk assessment signal based on the forensic accounting expertise of our subsidiary Gradient Analytics. We have found EQR quite valuable for helping to avoid performance-offsetting meltdowns in our model portfolios.
However, if you prefer to maintain a neutral bias, the Sector Rotation model suggests holding Healthcare, Technology, and Financial (in that order). And if you prefer a defensive stance on the market, the model suggests holding Utilities, Healthcare, and Technology (in that order).
IMPORTANT NOTE: Some readers have been asking for more specifics on how to trade our sector rotation strategy based solely on what I discuss in my weekly newsletter. Thus, I feel compelled to remind you that I post this information each week as a free look inside some of our institutional research and as a source of some trading ideas for your own further investigation. It is not intended to be traded directly as a rules-based strategy in a real money portfolio. I am simply showing what a sector rotation model might suggest if a given portfolio was due for a rebalance, and I may or may not update the information each week. There are many ways for a client to trade such a strategy, including monthly or quarterly rebalancing, perhaps with interim adjustments to the bullish/neutral/defensive bias when warranted -- but not necessarily on the days that I happen to post this weekly article. The enhanced strategy seeks higher returns by employing individual stocks (or stock options) that are also highly ranked, but this introduces greater risks and volatility. I do not track performance of the ETF and stock ideas mentioned here as a managed portfolio.
Disclosure: Author has no positions in stocks or ETFs mentioned.
Disclaimer: This newsletter is published solely for informational purposes and is not to be construed as advice or a recommendation to specific individuals. Individuals should take into account their personal financial circumstances in acting on any rankings or stock selections provided by Sabrient. Sabrient makes no representations that the techniques used in its rankings or selections will result in or guarantee profits in trading. Trading involves risk, including possible loss of principal and other losses, and past performance is no indication of future results.