Sector Detector: False breakout just another tease, but fundamental rankings are bullish
Rather than a Great Rotation from bonds into equities, the rotation instead has been from growth into value. Among the ten U.S. business sectors, uber-defensive sector Utilities is still the clear leader year-to-date, up more than +10%, followed by Energy and Healthcare. Healthcare and Materials were the leaders last week. Consumer Services/Discretionary remains the clear laggard YTD. Moreover, rather than bond prices falling, the 10-year Treasury yield has fallen even further to 2.52%, further indicating a flight to safety.
Of the 470 companies from the S&P 500 that have reported so far, nearly 70% have beaten estimates and 10% have met estimates. Defensive sectors Utilities and Telecom have shown the strongest Q1 earnings growth.
Although the strong U.S. economic fundamentals theoretically should be pushing interest rates up, macro and technical drivers have prevented it. Of course, this is good news and the best of both worlds, as low interest rates (without massive stimulus programs) and improving fundamentals bode well for economic growth and corporate earnings growth -- as well as stock prices.
The CBOE Market Volatility Index (VIX), a.k.a. fear gauge, closed last week at 12.44. It continues to creep downward, and remains firmly below the 15 threshold, indicating investor complacency about risk in their stock holdings.
ConvergEx reports that average sector correlations for the 10 business sectors of the S&P 500 have been averaging 79% recently, which is much lower than the 95% correlations displayed during the height of the risk-on/risk-off days of the past few years. Top-performing Utilities is a low 21%, while emerging markets clocks in at just 38%.
It seems like an opportune time for Sabrient to launch this year’s Forward Looking Value portfolio next month.
SPY chart review:
The SPDR S&P 500 Trust (SPY) closed Friday at 188.05, which is right about where it closed the previous week, and the week before that. Overhead resistance at 190 proved too strong, and price remains smack dab in the middle of the long-standing rising bullish channel. After briefly showing a desire to break out and display a triple-top buy signal, it turned out to be a false breakout. SPY has now returned back to its neutral sideways channel between roughly 187 and 189. Oscillators RSI, MACD, and Slow Stochastic remain in neutral, still giving no indication of direction. However, Bollinger Bands have suddenly pinched together, which generally indicates that a strong directional move is imminent.
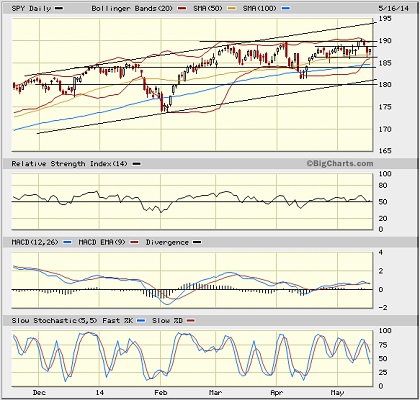
There is still a gap up from April 16 around 184 that has not been filled and continues to act as a magnet. Strong support continues to be provided by the 50-day simple moving average, which now coincides with the lower Bollinger Band. After that is the 100-day SMA, followed by gap support at 184. Below that is the bottom of the long-standing uptrend (currently near 181), followed by round-number support at 180, and then the 200-day SMA (near 178).
Notably, the iShares Russell 2000 small cap fund (IWM) remains below the 200-day simple moving average, and the index is struggling to hold round number support at 1100. On the other hand, the iShares MSCI Emerging Markets Index Fund (EEM) is well above its 200-day SMA and is rapidly approaching the breakeven level year-to-date.
Latest sector rankings:
Relative sector rankings are based on our proprietary SectorCast model, which builds a composite profile of each equity ETF based on bottom-up aggregate scoring of the constituent stocks. The “Outlook Score” employs a forward-looking, fundamentals-based multifactor algorithm considering forward valuation, historical and projected earnings growth, the dynamics of Wall Street analysts’ consensus earnings estimates and recent revisions (up or down), quality and sustainability of reported earnings (forensic accounting), and various return ratios. It helps us predict relative performance over the next 1-3 months.
In addition, SectorCast computes a “Bull Score” and “Bear Score” for each ETF based on recent price behavior of the constituent stocks on particularly strong and weak market days. High Bull score indicates that stocks within the ETF recently have tended toward relative outperformance when the market is strong, while a high Bear score indicates that stocks within the ETF have tended to hold up relatively well (“safe havens”) when the market is weak.
Outlook score is forward-looking while Bull and Bear are backward-looking. As a group, these three scores can be helpful for positioning a portfolio for a given set of anticipated market conditions. Of course, each ETF holds a unique portfolio of stocks and position weights, so the sectors represented will score differently depending upon which set of ETFs is used. We use the iShares that represent the ten major U.S. business sectors: Financial (IYF), Technology (IYW), Industrial (IYJ), Healthcare (IYH), Consumer Goods (IYK), Consumer Services (IYC), Energy (IYE), Basic Materials (IYM), Telecommunications (IYZ), and Utilities (IDU). Whereas the Select Sector SPDRs only contain stocks from the S&P 500, I prefer the iShares for their larger universe and broader diversity. Fidelity also offers a group of sector ETFs with an even larger number of constituents in each.
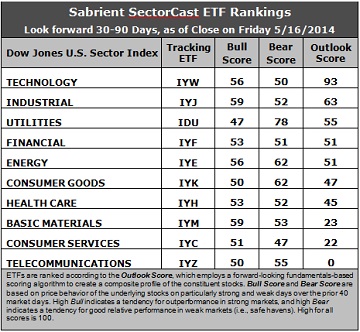
Here are some of my observations on this week’s scores:
1. The Outlook scores are mostly the same this week. Technology remains in first place with a robust Outlook score of 93 -- anything above 90 is quite impressive. Industrial stays in second place with a 63, providing a bit more of a gap above third place Utilities at 55. Technology generally displays solid factor scores across the board, with a strong forward long-term growth rate, a reasonable forward P/E, the highest return ratios, and positive sentiment among Wall Street analysts (upward revisions to earnings estimates), along with improving insider sentiment (buying activity). Industrial displays a good forward long-term growth rate, solid return ratios, and strong sentiment among sell-side analysts. Financial and Energy once again round out the top five.
2. Telecommunications stay in the cellar with an Outlook score of 0 again, as it scores at the bottom in every factor in the model. It is joined in the bottom two once again by Consumer Services/Discretionary with a score of 22.
3. Looking at the Bull scores, Industrial and Basic Materials share the lead at 59, while Utilities is the laggard with a 47. In fact, Utilities is the only sector scoring below 50 this week. The top-bottom spread is only 12 points, reflecting relatively high sector correlations on particularly strong market days. It is generally desirable in a healthy market to see a top-bottom spread of at least 20 points, which indicates that investors have clear preferences in the stocks they want to hold, rather than the all-boats-lifted-in-a-rising-tide mentality that dominated 2013.
4. Looking at the Bear scores, Utilities continues hold up well, scoring 78, which means that stocks within this defensive sector have been the preferred “safe havens” on weak market days. Energy is second at 62. Consumer Services scores the lowest at 47. The top-bottom spread is a highly robust 31 points, reflecting extremely low sector correlations on particularly weak market days. Again, it is generally desirable in a healthy market to see a top-bottom spread of at least 20 points.
5. Technology displays by far the best all-weather combination of Outlook/Bull/Bear scores, followed by Utilities. Telecom is the worst, followed by Consumer Services. Looking at just the Bull/Bear combination, Utilities is the clear leader (corroborated by its strong performance this year, as well), followed by Energy, which actually displays the best balance between its Bull and Bear scores, indicating superior relative performance (on average) in extreme market conditions (whether bullish or bearish). Consumer Services scores by far the lowest, indicating general investor avoidance during extreme conditions, and this has been corroborated by its underperformance so far this year.
6. Overall, I would have to interpret this week’s Outlook rankings as slightly more bullish than last week -- even though the rankings haven’t changed much and I called them neutral last week. Four of the top five sectors also display high Bull scores (the exception is Utilities), and Industrial has pulled away from a tightly-packed middle group of the next five sectors, indicating additional bullish conviction.
These Outlook scores represent the view that Technology and Industrial sectors are relatively undervalued, while Consumer Services and Telecom may be relatively overvalued based on our 1-3 month forward look.
Stock and ETF Ideas:
Our Sector Rotation model, which appropriately weights Outlook, Bull, and Bear scores in accordance with the overall market’s prevailing trend (bullish, neutral, or bearish), suggests holding Technology, Industrial, and Basic Materials in the prevailing bullish climate. (In this particular model, we consider the bias to be bullish from a rules-based standpoint because SPY is still above its 50-day simple moving average while also remaining above its 200-day SMA.)
Other ETFs that are ranked high by our algorithm from the Technology, Industrial, and Materials sectors include PowerShares Dynamic Semiconductor ETF (PSI), SPDR S&P Transportation ETF Trust (XTN), and PowerShares S&P Small Cap Materials Portfolio (PSCM).
For an “enhanced” sector portfolio that enlists top-ranked stocks (instead of ETFs) from within Technology, Industrial, and Materials, some long ideas include SanDisk Corp (SNDK), Open Table (OPEN), Alaska Air Group (ALK), United Parcel Service (UPS), Balchem (BCPC), and Westlake Chemical (WLK). All are ranked highly in the Sabrient Ratings Algorithm and also score within the top quintile of our Earnings Quality Rank (EQR), a pure accounting-based risk assessment signal based on the forensic accounting expertise of our subsidiary Gradient Analytics. We have found it quite valuable for helping to avoid performance-offsetting meltdowns in our model portfolios.
However, if you are more comfortable with a neutral bias, the model suggests holding Technology, Industrial, and Utilities. On the other hand, if you have a bearish outlook on the market, the model suggests holding Utilities, Energy, and Consumer Goods/Staples.
Disclosure: Author has no positions in stocks or ETFs mentioned.
Disclaimer: This newsletter is published solely for informational purposes and is not to be construed as advice or a recommendation to specific individuals. Individuals should take into account their personal financial circumstances in acting on any rankings or stock selections provided by Sabrient. Sabrient makes no representations that the techniques used in its rankings or selections will result in or guarantee profits in trading. Trading involves risk, including possible loss of principal and other losses, and past performance is no indication of future results.