Sector Detector: Bulls are all dressed up, but might have no place to go
 Stock market bulls made a valiant effort to fight off another looming correction last week. The economy is showing strong signs of recovery, the Fed remains confident enough to continue its stimulus tapering, and attractive alternative investments to the U.S. stock market seem scarce. Yes, bulls are all dressed up for more fun times. However, the technical picture paints a different story, at least for the near term. So don’t back up the truck just yet. Caution is in order.
Thursday showed improving manufacturing data, personal income and spending. Friday's Government Employment Situation report showed that 288,000 joined the payrolls. University of Michigan Consumer Confidence jumped to the highest level since last July. Oil and gas is plentiful. The US dollar is relatively weak, helping the multinationals’ earnings. Pending home sales rebounded in March, the first increase in nine months. Global hot spots (e.g., Ukraine, Iraq, Afghanistan) continue to push global investors into the U.S. The 10-year Treasury yield continued to fall, closing Friday at 2.58%. And as discussed below, Sabrient’s fundamentals-based sector rankings are bullish.
Indeed, the CIO of the California State Teachers’ Retirement System has stated that the nation’s second largest public pension fund can’t figure out where to invest $183 billion outside of U.S. equities. Even though stocks might be getting fatigued, the firm sees few attractive alternatives in which to invest.
So, the setup is clear for an improving economy and growing GDP. But that doesn’t mean the stock market will continue to go straight up from here. Near-term technicals are worrisome, margin debt has reached an all-time high, and trading volume in highly speculative penny stocks has soared to new highs.
The CBOE Market Volatility Index (VIX), a.k.a. “fear gauge,” closed last week at 12.91 and remains firmly below the 15 threshold, indicating low investor trepidation about their stocks. But from a contrarian basis, it is once again oversold and ready to spike up at any time. Buy-to-open call volume on VIX futures is near record levels, meaning that the “smart money” has taken on a risk-reduction mindset that makes the major resistance levels hard to crack.
My view is that the market is poised to endure a significant pullback soon before hitting new highs later in the year.
SPY chart review:
The SPDR S&P 500 Trust (SPY) closed Friday at 188.06, which is up nicely from last week and appears to have negated the head-and-shoulders pattern. However, this doesn’t mean that all is well again in Whoville. Thursday and Friday were uninspiring, and Friday’s candlestick looked quite bearish -- a red engulfing pattern with a long upper shadow. Overhead resistance is strong. Oscillators RSI, MACD, and Slow Stochastic all appear to be rolling over, and there is a gap up on April 16 from about 184 that will act as a magnet to be filled and tested. Minor support sits nearby at 187, but the 50-day simple moving average is likely the first level of strong support (near 186), followed by the convergence of gap support at 184 with the 100-day SMA. Below that is the bottom of the long-standing uptrend (currently near 180) and then the 200-day SMA (around 178).
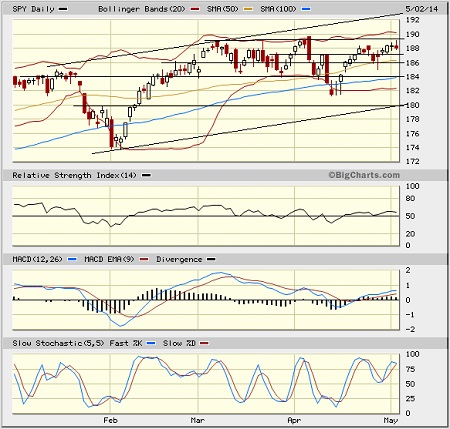
The broad market indexes have struggled to break through strong round-number resistance, including the S&P 500 at 1,900 and the Wilshire 5000 at 20,000. Also, the Russell 2000 and NASDAQ are struggling from far below their March highs.
Latest sector rankings:
Relative sector rankings are based on our proprietary SectorCast model, which builds a composite profile of each equity ETF based on bottom-up aggregate scoring of the constituent stocks. The “Outlook Score” employs a forward-looking, fundamentals-based multifactor algorithm considering forward valuation, historical and projected earnings growth, the dynamics of Wall Street analysts’ consensus earnings estimates and recent revisions (up or down), quality and sustainability of reported earnings (forensic accounting), and various return ratios. It helps us predict relative performance over the next 1-3 months.
In addition, SectorCast computes a “Bull Score” and “Bear Score” for each ETF based on recent price behavior of the constituent stocks on particularly strong and weak market days. High Bull score indicates that stocks within the ETF recently have tended toward relative outperformance when the market is strong, while a high Bear score indicates that stocks within the ETF have tended to hold up relatively well (“safe havens”) when the market is weak.
Outlook score is forward-looking while Bull and Bear are backward-looking. As a group, these three scores can be helpful for positioning a portfolio for a given set of anticipated market conditions. Of course, each ETF holds a unique portfolio of stocks and position weights, so the sectors represented will score differently depending upon which set of ETFs is used. We use the iShares that represent the ten major U.S. business sectors: Financial (IYF), Technology (IYW), Industrial (IYJ), Healthcare (IYH), Consumer Goods (IYK), Consumer Services (IYC), Energy (IYE), Basic Materials (IYM), Telecommunications (IYZ), and Utilities (IDU). Whereas the Select Sector SPDRs only contain stocks from the S&P 500, I prefer the iShares for their larger universe and broader diversity. Fidelity also offers a group of sector ETFs with an even larger number of constituents in each.
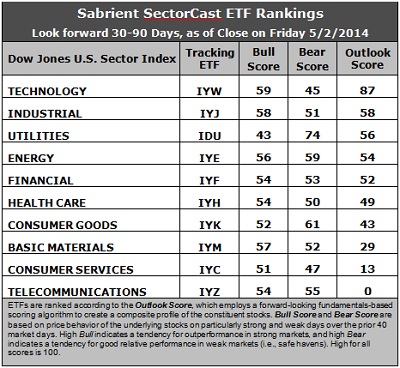
Here are some of my observations on this week’s scores:
1. Technology remains in first place with a robust Outlook score of 87. Industrial stays in second place with a 58. Technology generally displays solid factor scores across the board, with a strong forward long-term growth rate, a reasonable forward P/E, the highest return ratios, and positive sentiment among Wall Street analysts (upward revisions to earnings estimates), although insider sentiment is only moderate (insider buying activity). Industrial displays a good forward long-term growth rate, solid return ratios, and strong sentiment among sell-side analysts. Energy and Financial round out the top five.
2. Telecommunications returns to the cellar with an Outlook score of 0 as it is at or very near the bottom in every factor in the model. It is joined in the bottom two once again by Consumer Services/Discretionary with a score of 13.
3. Looking at the Bull scores, Technology is the leader at 59, while Utilities is by far the laggard with a low score of 43. In fact, Utilities is the only sector scoring below 50 this week. The top-bottom spread 16 points, reflecting relatively low sector correlations on particularly strong market days -- although it is generally desirable in a healthy market to see a top-bottom spread of at least 20 points, which indicates that investors have clear preferences in the stocks they want to hold, rather than the “all-boats-lifted-in-a-rising-tide” mentality that we saw during 2013.
4. Looking at the Bear scores, Utilities continues to increase, this week scoring 74, which means that stocks within this defensive sector have been the preferred “safe havens” on weak market days. Technology scores the lowest at 45. The top-bottom spread is a robust 29 points, reflecting very low sector correlations on particularly weak market days. Again, it is generally desirable in a healthy market to see a top-bottom spread of at least 20 points.
5. Technology displays the best all-weather combination of Outlook/Bull/Bear scores, while Telecom is the worst. Looking at just the Bull/Bear combination, Utilities is the leader solely on the strength of its Bear score, but Energy is close behind as it now displays solid Bull and Bear scores, indicating superior relative performance (on average) in extreme market conditions (whether bullish or bearish). Consumer Services scores by far the lowest, indicating general investor avoidance during extreme conditions.
6. Overall, this week’s Outlook rankings still look bullish, with five of the top six sectors also displaying high Bull scores (the exception is Utilities). Notably, the Bull score for Energy has transitioned to the higher end, so this sector now can be considered in the bullish camp once again.
These Outlook scores represent the view that Technology and Industrial sectors are relatively undervalued, while Consumer Services and Telecom may be relatively overvalued based on our 1-3 month forward look.
Stock and ETF Ideas:
Our Sector Rotation model, which appropriately weights Outlook, Bull, and Bear scores in accordance with the overall market’s prevailing trend (bullish, neutral, or bearish), suggests holding Technology, Industrial, and Energy in the prevailing bullish climate. (In this particular model, we consider the bias to be bullish from a rules-based standpoint because SPY is still above its 50-day simple moving average while also remaining above its 200-day SMA.)
Other ETFs that are ranked high by our algorithm from the Technology, Industrial, and Energy sectors include PowerShares Dynamic Semiconductors Portfolio (PSI), SPDR S&P Transportation ETF (XTN), and PowerShares Dynamic Energy Exploration & Production Portfolio (PXE).
For an “enhanced” sector portfolio that enlists top-ranked stocks (instead of ETFs) from within Technology, Industrial, and Energy, some long ideas include Zillow Inc (Z), SanDisk Corp (SNDK), Roper Industries (ROP), Middleby Corp (MIDD), Valero Energy (VLO), and Whiting Petroleum (WLL). All are ranked highly in the Sabrient Ratings Algorithm and also score within the top quintile of our Earnings Quality Rank (EQR), which is a pure accounting-based risk assessment signal based on the forensic accounting expertise of our subsidiary Gradient Analytics. We have found EQR quite valuable for helping to avoid performance-offsetting meltdowns in our model portfolios.
However, if you are more comfortable with a neutral bias, the model suggests holding Technology, Industrial, and Utilities. On the other hand, if you have a bearish outlook on the market, the model suggests holding Utilities, Energy, and Consumer Goods/Staples.
Disclosure: Author has no positions in stocks or ETFs mentioned.
Disclaimer: This newsletter is published solely for informational purposes and is not to be construed as advice or a recommendation to specific individuals. Individuals should take into account their personal financial circumstances in acting on any rankings or stock selections provided by Sabrient. Sabrient makes no representations that the techniques used in its rankings or selections will result in or guarantee profits in trading. Trading involves risk, including possible loss of principal and other losses, and past performance is no indication of future results.