Sector Detector: Bullish sentiment solidifies even in the face of lofty valuations
The stock market rally from the edge-of-the-cliff reversal on February 12 has continued, and an assault on the all-time highs from almost one year ago (on the S&P 500) now seems plausible. If it can hit new highs, the 7-year bull market is back in business. We are about halfway through earnings season, and after several years of record corporate earnings that were at least partly fueled by Fed policies that helped finance M&A and stock buybacks, some fear that profit margins have peaked. Earnings have contracted for three straight quarters while GDP has weakened, and Apple (AAPL) certainly didn’t help the cause. All of this has pushed up stock valuations to what many feel are as high as they can go without a meaningful improvement in the prospects for corporate earnings -- with the S&P 500 trading near 18x this year's consensus estimate for the S&P 500 of $115. But all is not lost, and investors seem to be comfortable with the prospects for the second half of the year, even as we enter the May-October “summer doldrums.”
In this periodic update, I give my view of the current market environment, offer a technical analysis of the S&P 500 chart, review our weekly fundamentals-based SectorCast rankings of the ten U.S. business sectors, and then offer up some actionable ETF trading ideas.
Market overview:
Helping the stock market along has been a weaker dollar and a firm bid in oil, with WTI currently trading around $46/bbl. The strength of crude has helped compress credit spreads, which has also helped investor sentiment. Looking ahead, U.S. GDP is expected to expand at a rate of around 2% this year, while earnings weakness should persist until an expected recovery of double-digit growth in the second half. Consensus forecasts show domestic inflation picking up to 1-1.5% later this year, assuming oil prices continue to stabilize, while interest rates remain low around the globe. Europe is expected to pick up some momentum with full-year growth of around 1%, and global GDP overall may rise to perhaps 3%. These conditions would help global investors gain confidence and relieve buying pressure on U.S. Treasuries, allowing a healthy steepening of the yield curve.
Of course, the earnings report from juggernaut Apple (AAPL) was a big disappointment for the market. With flagging iPhone sales, the firm reported its first year-over-year revenue decline since 2003, which sent its shares to test 52-week lows. EPS came in lower than expected and total profit fell by nearly $3 billion (to $10.5 billion) for the quarter. Revenue fell 13% on horrid sales in Asia, with China sales falling by 26%. As of Monday, the stock has fallen for 8 straight days and 11 of the past 12 days.
AAPL makes up a huge proportion of the Tech sector, and the Tech sector has the largest representation in the S&P 500 at 21%, so weakness in AAPL will impact the market’s ability to move higher from here, particularly given the seasonality. Perhaps investors will start looking ahead to the iPhone 7 release later this year. Besides earnings season, other potential market movers are the June vote on a “Brexit” (Britain exiting the EU), the FOMC rate hike decision in June, China’s decision on whether to further devalue the yuan, and of course the crazy goings-on in the US presidential race.
However, I would like to point out that after a long stretch characterized by narrow market breadth (including most of last year), there have been signs of broadening over the past several weeks, which is healthy for the market overall. To illustrate the previous lack of market breadth, let’s compare how large caps have performed versus smalls, and how market-cap-weighted indexes have performed against the equal-weighted indexes, since last summer when the indexes peaked. The large cap S&P 500 Index peaked on 5/21/2015, and then the small cap Russell 2000 Index peaked on 6/23/2015.
In a healthy market, equal weighting typically outperforms as the bias toward value and small caps is more pronounced. However, the cap-weighted S&P 500 Index has greatly outperformed the equal-weighted Russell 2000 Equal Weight Index, which is not desirable. From 6/23/2015 through 4/29/2016, the large cap, market-cap-weighted S&P 500 Index is -2.8% while the small cap Russell 200 Equal Weight Index is -12.7%. So, the performance spread between them is 9.5%. Although this gap is still large, it actually has narrowed considerably from the unsettling 16% performance spread we saw for 6/23/2015 through 2/11/2016 (when the market bottomed). This falling spread indicates a gradual broadening of the market, which is good both for active stock-picking (versus passive indexing) and for equal weighting (versus market-cap weighting). And of course, history tells us that markets eventually rotate back into fundamentally sound stocks (i.e., a flight to quality), which appears to be happening.
To further illustrate this healthy broadening, on February 12 the market turned strongly to the upside. Initially, it seemed to be led by the usual combination of short-covering, oversold bottom-feeding, and speculation, but then it began what appears to me to be a rotation into higher quality stocks. Indeed, for the timeframe 2/11/2016 - 4/29/2016, the S&P 500 cap-weighted large cap index is +11.5% while the Russell 2000 Equal Weight small cap index is +22.9% (double the performance).
As you recall, the narrow market breadth last year led to the creation of the “FANG” acronym given the outperformance of Facebook (FB), Amazon (AMZN), Netflix (NFLX), and Google (GOOGL). This year, FB has continued to perform well and AMZN got a nice pop from earnings last week, but on the other hand NFLX and GOOGL are solidly in the negative. Notably, media giant CBS Corp (CBS) was cast aside last year while next-gen NFLX was flying high, but since February 11, CBS is +28.3% while NFLX is +4.3% -- a 24% performance differential. And YTD, there is a 38% performance differential in favor of CBS. This further illustrates what I mean by the flight to quality, because CBS owns reams of content and trades at a modest forward P/E, while NFLX must license much of its content and trades at a high forward P/E.
Notably, during the 2/11/15 - 4/29/16 timeframe of the stock market recovery, Oil is up +42.5%. Also, the Market Vectors Junior Gold Miners ETF (GDXJ) has been on a tear, having risen about +60% over the same timeframe -- and nearly +100% year-to-date, while Gold itself is +21.9% YTD in US dollars. The USD has weakened this year, down -11% vs. Yen, -5.1% vs Euro, and -9.4% vs. CDN dollar, which has further supported US equities. So, equities are still largely dependent on oil prices, Fed policy (fed funds rates and impact on USD), and China’s situation (growth rate and currency devaluations).
The Fed certainly does not want to be the one to upset the apple cart. Before there are any further rate hikes, the FOMC will want to see economic data that demonstrates progress toward its inflation and employment targets. The highly prescient Fed funds futures are indicating only a 13% probability of a rate hike in June, but it rises to 30% probability in July, 42% for at least one hike by September, and 62% probability of at least one rate hike by December (and 21% chance of two rate hikes by then).
But it is certainly worth reiterating that since last December’s initial rate hike, the US dollar has weakened against other major currencies, even though the ECB and BOJ moved to negative rates. As Brian Wesbury of First Trust has pointed out, negative interest rates encourage people to hold cash, which slows the growth of money supply and the multiplier effect, while slightly higher rates serves to accelerate money supply growth rates by incentivizing banks to lend. In addition, with over $2.25 trillion in excess bank reserves, the Fed remains highly accommodative in its overall monetary policy (irrespective of the fed funds rate), which is intended to be inflationary.
However, as I will say yet again, what we really need is the leadership to craft structural reforms and fiscal policies rather than relying solely on the monetary policies of low interest rates and abundant liquidity. Simply creating inflationary monetary policy is not enough to support an economy. With aging baby boomers controlling the bulk of global assets, especially here in the US, their self-interest is to maintain the status quo and pass along assets to their heirs, who will continue to collect rents from the masses. Inflationary monetary policy serves to elevate asset prices, essentially keeping assets out of reach of the next generations, which stagnates economic vitality and growth while exacerbating the wealth gap. The electorate seems to understand this, which is why populist messages have garnered so much traction in the presidential race, from both sides of the aisle.
Last week, both Scott Minerd of Guggenheim Partners and Jeffrey Gundlach of DoubleLine Capital suggested that buying Treasuries into the selloff is a prudent move, particularly given the lofty levels of the equity indices. Still, even after the brief selloff in Treasuries, the 10-year yield closed Monday at a modest 1.87%, and the 2-year closed at 0.79%. The CBOE Market Volatility Index (VIX), aka fear gauge, closed Monday at 14.68 and is back below the 15 fear/complacency threshold after a brief spike above 15 during last week’s market pullback.
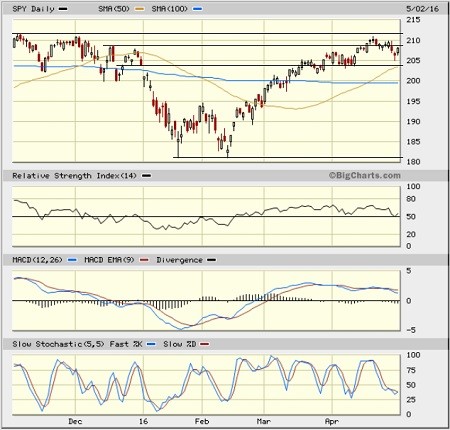
SPY chart review:
The SPDR S&P 500 Trust (SPY) closed Monday just shy of 208 and remains above all its major moving averages (i.e., 20-day, 50-day, 100-day, and 200-day). The 50-day SMA has crossed bullishly upward through the 200-day SMA, which has flat-lined near 202. Last Friday brought a bullish hammer candlestick on elevated volume, as seller seem to have exhausted themselves on the monthly close and buyers rushed in to buy, and then Monday confirmed the bullish pattern, at least for the near term. So, I think resistance levels likely will be tested -- first at 209 and then the November high near 212 -- and possibly the all-time high from last May at 214. Oscillators RSI, MACD, and Slow Stochastic are all in neutral positions, and for the near term they appear more likely to continue up than turn down. However, with the onset of the May-October summer doldrums, SPY may simply remain in a trading channel between 204 (or perhaps 200 or the 200-day SMA at 202) on the bottom and 209 (or perhaps 212) on the top until a strong catalyst emerges.
Latest sector rankings:
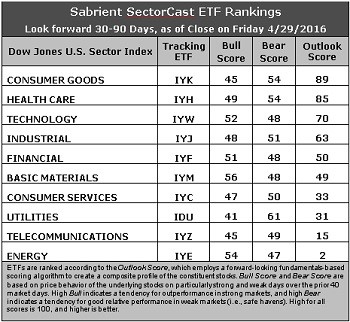
Relative sector rankings are based on our proprietary SectorCast model, which builds a composite profile of each equity ETF based on bottom-up aggregate scoring of the constituent stocks. The Outlook Score employs a forward-looking, fundamentals-based multifactor algorithm considering forward valuation, historical and projected earnings growth, the dynamics of Wall Street analysts’ consensus earnings estimates and recent revisions (up or down), quality and sustainability of reported earnings (forensic accounting), and various return ratios. It helps us predict relative performance over the next 1-3 months.
In addition, SectorCast computes a Bull Score and Bear Score for each ETF based on recent price behavior of the constituent stocks on particularly strong and weak market days. High Bull score indicates that stocks within the ETF recently have tended toward relative outperformance when the market is strong, while a high Bear score indicates that stocks within the ETF have tended to hold up relatively well (i.e., safe havens) when the market is weak.
Outlook score is forward-looking while Bull and Bear are backward-looking. As a group, these three scores can be helpful for positioning a portfolio for a given set of anticipated market conditions. Of course, each ETF holds a unique portfolio of stocks and position weights, so the sectors represented will score differently depending upon which set of ETFs is used. We use the iShares that represent the ten major U.S. business sectors: Financial (IYF), Technology (IYW), Industrial (IYJ), Healthcare (IYH), Consumer Goods (IYK), Consumer Services (IYC), Energy (IYE), Basic Materials (IYM), Telecommunications (IYZ), and Utilities (IDU). Whereas the Select Sector SPDRs only contain stocks from the S&P 500, I prefer the iShares for their larger universe and broader diversity. Fidelity also offers a group of sector ETFs with an even larger number of constituents in each.
Here are some of my observations on this week’s scores:
1. Consumer Goods (Staples/Noncyclical) has moved into the top spot with an Outlook score of 89, primarily due to the best Wall Street analyst sentiment (net positive revisions to earnings estimates), the strongest return ratios, and solid insider sentiment (buying activity). However, the sector’s forward valuation is on the pricey side (about 18.3x). Healthcare is a close second at 85, with generally solid factor scores across the board. Technology takes third with a 70, and it boasts the highest forward long-term growth rate at 12.9x, although this reflects a lower growth rate than previous estimates. Rounding out the top of the rankings are Industrial (which continues to rise), Financial, Basic Materials, and Consumer Services, which are all economically sensitive sectors. Notably, after weeks of downward revisions to earnings estimates, there are some pockets of strength revealed this week, particularly in Consumer, Materials, Industrial, and Healthcare. Financial still displays the lowest aggregate forward P/E (14.9x), but the sector continues to be the target of analysts’ negative revisions to earnings estimates.
2. Energy remains mired firmly at the bottom with an Outlook score of 2 as the sector scores among the worst in all factors of the GARP model, including by far the highest forward P/E at 27x. On the bright side, however, its forward long-term growth rate has suddenly turned positive, perhaps as some drivers for higher oil prices gain traction. Telecom takes the other spot in the bottom two with an Outlook score of 15. Notably, Utilities has fallen to an Outlook score of 31, not so much due to changes in the sector itself, but rather to relative improvement in the outlook for other sectors.
3. Looking at the Bull scores, Basic Materials remains at the top of the list with a 56 as it continues to display relative strength on strong market days, while Utilities is the lowest at 41. The top-bottom spread is 15 points, which reflects moderately low sector correlations on strong market days, which can be good for stock picking. It is desirable in a healthy market to see low correlations reflected in a top-bottom spread of at least 20 points, which indicates that investors have clear preferences in the stocks they want to hold (rather than broad risk-on behavior).
4. Looking at the Bear scores, Utilities (as usual) displays the top score of 61, which means that stocks within this sector have been the preferred safe havens on weak market days. Energy scores the lowest at 47, as investors flee during market weakness (which generally has been correlated with falling oil prices). The top-bottom spread is 14 points, which reflects moderately low sector correlations on weak market days, which can be good for stock picking. Ideally, certain sectors will hold up relatively well while others are selling off (rather than broad risk-off behavior), so it is desirable in a healthy market to see low correlations reflected in a top-bottom spread of at least 20 points.
5. Consumer Goods (Staples/Noncyclical) and Healthcare share the best all-around combination of Outlook/Bull/Bear scores, while Energy is the worst. However, looking at just the Bull/Bear combination, Basic Materials is the best, indicating superior relative performance (on average) in extreme market conditions (whether bullish or bearish), while Telecom is the worst.
6. I have to say that, despite defensive sector Consumer Goods (Staples/Noncyclical) showing up at the top, this week’s fundamentals-based Outlook rankings look mostly bullish to me, given the scoring strength in Healthcare, Technology, Industrial, Financial, and Basic Materials, and the relative weakness of Utilities and Telecom. This is the first time in quite awhile that the rankings seem to line up with the bullish technical picture, but I will have to see if it persists or if this was just a passing anomaly. Keep in mind, the Outlook Rank does not include timing, momentum, or relative strength factors, but rather is a reflection of the fundamental expectations for individual stocks aggregated by sector.
ETF Trading Ideas:
Our Sector Rotation model, which appropriately weights Outlook, Bull, and Bear scores in accordance with the overall market’s prevailing trend (bullish, neutral, or defensive), still reflects a bullish bias and suggests holding Basic Materials, Technology, and Healthcare, in that order. (Note: In this model, we consider the bias to be bullish from a rules-based trend-following standpoint when SPY is above both its 50-day and 200-day simple moving averages.)
Besides iShares’ IYM, IYW, and IYH, Other highly-ranked ETFs in SectorCast from the Basic Materials, Technology, and Healthcare sectors include PowerShares DWA Basic Materials Momentum Portfolio (PYZ), SPDR S&P Software & Services ETF (XSW), and SPDR S&P Pharmaceuticals ETF (XPH). Others scoring near the top of the rankings with a strong combination of Outlook and Bull Scores include PureFunds ISE Mobile Payments ETF (IPAY) and Market Vectors Morningstar Wide Moat ETF (MOAT).
If you prefer to stick with a neutral bias, the Sector Rotation model suggests holding Consumer Goods (Staples/Noncyclical), Healthcare, and Technology, in that order. On the other hand, if you prefer a defensive stance on the market, the model suggests holding Utilities, Consumer Goods (Staples/Noncyclical), and Healthcare, in that order.
IMPORTANT NOTE: I post this information periodically as a free look inside some of our institutional research and as a source of some trading ideas for your own further investigation. It is not intended to be traded directly as a rules-based strategy in a real money portfolio. I am simply showing what a sector rotation model might suggest if a given portfolio was due for a rebalance, and I may or may not update the information on a regular schedule. There are many ways for a client to trade such a strategy, including monthly or quarterly rebalancing, perhaps with interim adjustments to the bullish/neutral/defensive bias when warranted -- but not necessarily on the days that I happen to post this article. The enhanced strategy seeks higher returns by employing individual stocks (or stock options) that are also highly ranked, but this introduces greater risks and volatility. I do not track performance of the ideas mentioned here as a managed portfolio.
Disclosure: Author has no positions in stocks or ETFs mentioned.
Disclaimer: This newsletter is published solely for informational purposes and is not to be construed as advice or a recommendation to specific individuals. Individuals should take into account their personal financial circumstances in acting on any rankings or stock selections provided by Sabrient. Sabrient makes no representations that the techniques used in its rankings or selections will result in or guarantee profits in trading. Trading involves risk, including possible loss of principal and other losses, and past performance is no indication of future results.