Sector Detector: Another resistance level turning into a launch pad
Well,  Punxsutawney Phil didn’t see his shadow on Saturday, so the weather forecast is positive. However, investors having their own version of Groundhog Day at Dow 14,000 and S&P500 1500 are still trying to decide whether to retreat to safety in anticipation of a severe market pullback. Weakness on Tuesday seemed like the start of a correction, but alas the bulls would have none of that.
Technical consolidation rather than a steep correction is still the M.O. Although bulls are struggling to turn yet another resistance level into a new launching pad, we have seen this dance before numerous times since mid-November—and really since the Fed quant easing programs launched the March 2009 V-bottom. The all-time intraday high for the S&P500 at 1576 (and 1565 closing high) sure seem to be in play for 2013 as some market commentators are thinking we have entered a secular bull market.
Of course, the ongoing Federal budget negotiations and looming sequester deadline on March 1 are the proverbial elephant in the room. But another possible fly in the ointment was pointed out by Mark Hulbert on MarketWatch on Wednesday when he noted that insiders are aggressively selling shares at an alarming pace. He says the last time the weekly sell-to-buy ratio was worse was in late July 2011, just before the debt-ceiling debacle and resultant U.S. credit rating downgrade. As you recall, the Dow eventually fell 2,000 points.
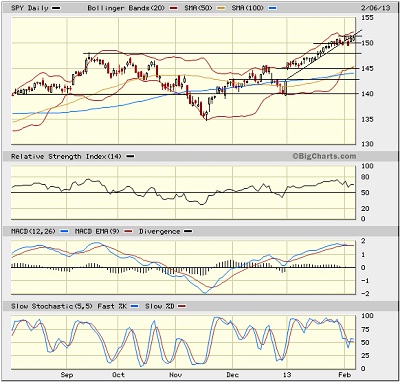
The S&P500 SPDR Trust (SPY) closed Wednesday at 151.16 as it continues a slow technical consolidation since breaking out above tough psychological resistance at 150. The 50-day simple moving average has held after crossing bullishly through the 100-day SMA. Oscillators RSI and MACD have been slow to cycle back down from overbought, while Slow Stochastic is flat-lining at the neutral line.

Since Friday’s burst back through 150, SPY has spent the first three days this week testing resistance-turned-support and consolidating within a sideways channel. The uptrend line of support starting from the bottom of the New Year’s gap might ultimately turn into the pole of a bull flag continuation pattern. Until the market can resume its uptrend, the New Year’s gap between 142 and 145 is going to act as something of a magnet, since gaps tend to get at least partially filled. After the uptrend line, next support levels are 150, 148, and then the convergence of the 50-day SMA and the top of the gap at 145.
The CBOE Market Volatility Index (VIX), a.k.a. “fear gauge,” closed Wednesday at 13.41, and 14 seems to be offering some resistance (which of course is bullish for equities). It is possible for the VIX to continue to work off its extremely overbought technical condition without stocks giving up too much ground.
Although the frothy technicals are worrisome, odds are that the market goes up from here. A number of commentators have been pointing out similarities in chart patterns to prior periods just before the market tanked. And yes, chart patterns do tend to repeat…until they don’t. There is always an eventual break in a pattern. Although “This time is different” can be famous last words, it’s also true that external conditions do change and new catalysts arise.
Today, the Fed remains accommodative, still pumping $85 billion per month into mortgage-backed securities and Treasuries. Manufacturing is looking stronger. Jobs growth is ever so gradually accelerating. Corporate profits are generally stronger than expected. And the U.S. economy continues to expand while Europe stabilizes. VIX remains historically low. There’s lots of cash in corporate coffers and on the sidelines, itching to get in on the action. The “risk-on/risk-off” asset allocation theme (with high equity correlations) appears to be giving way to a lower-correlation stock-picking climate. Overall, equities should continue to attract investors in this environment.
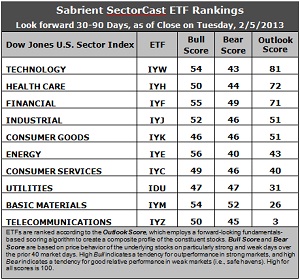
Latest rankings: The table ranks each of the ten U.S. industrial sector iShares (ETFs) by Sabrient's proprietary Outlook Score, which employs a forward-looking, fundamentals-based, quantitative algorithm to create a bottom-up composite profile of the constituent stocks within the ETF. The multi-factor model considers forward valuation, historical earnings trends, earnings growth prospects, the dynamics of Wall Street analysts' consensus estimates, accounting practices and earnings quality, and various return ratios. In addition, the table also shows Sabrient's proprietary Bull Score and Bear Score for each ETF.
High Bull score indicates that stocks within the ETF have tended recently toward relative outperformance during particularly strong market periods, while a high Bear score indicates that stocks within the ETF have tended to hold up relatively well during particularly weak market periods. Bull and Bear are backward-looking indicators of recent sentiment trend.
As a group, these three scores can be quite helpful for positioning a portfolio for a given set of anticipated market conditions.

Observations:
1. Not much changed in this week’s rankings. Technology (IYW) stays in the top spot with a score of 81, while Healthcare (IYH) moves back into second place by one point in its battle with Financial (IYF). IYW shows strong projected growth and the best forward valuation, as well as solid return ratios. IYH got some renewed support from Wall Street analysts, although IYF is actually enjoying the most net upgrades.
2. Telecom (IYZ) stays in the cellar with a dismal Outlook score of 3, as Wall Street has continued to slash estimates. It is again joined in the bottom two this week by Basic Materials (IYM) with a 26 as analysts continued to slash away at forward estimates in the sector.
3. Overall, this week’s rankings are a little less bullish than last week. Industrial (IYJ) and Consumer Services (IYC) both fell in their scores, while defensive sectors Consumer Goods (IYK) and Healthcare (IYH) rose.
4. Looking at the Bull scores, Energy (IYE) is the leader on strong market days, scoring 56, while Consumer Goods (IYK) is the laggard on strong market days, scoring 46. This is only a 10-point range from top to bottom, which indicates high correlation on particularly strong market days. Energy stocks have tended to perform the best when the market is rallying, while Consumer Goods stocks have lagged.
5. Looking at the Bear scores, Basic Materials (IYM), which used to be among the worst on weak days, is scoring the highest at 52. Energy (IYE) is the worst during market weakness, as reflected in its low Bear score of 40. But there’s still only a 12-point range from top to bottom, which indicates high correlation on particularly weak market days. Energy stocks, which are the strongest on particularly strong market days, have been selling off the most when the market is pulling back, while Materials stocks have held up the best, relatively speaking.
6. Overall, Technology (IYW) shows the best all-weather combination of Outlook/Bull/Bear scores. Adding up the three scores gives a total of 178, followed by Financial (IYF) at 175. Telecom (IYZ) is by far the worst at 98. Looking at just the Bull/Bear combination, Consumer Goods (IYK) is the lowest at 92, while Basic Materials (IYM) has the best score at 106, followed by Financial (IYF) at 104. This indicates that Materials stocks have tended to perform relatively well lately in all market conditions.
These scores represent the view that the Technology and Healthcare sectors may be relatively undervalued overall, while Telecom and Basic Materials sectors may be relatively overvalued based on our 1-3 month forward look.
Top-ranked stocks within IYW and IYH include F5 Networks (FFIV), 3D Systems (DDD), MEDNAX (MD), and Humana (HUM).
Disclosure: Author has no positions in stocks or ETFs mentioned.
About SectorCast: Rankings are based on Sabrient’s SectorCast model, which builds a composite profile of each equity ETF based on bottom-up aggregate scoring of the constituent stocks. The Outlook Score employs a fundamentals-based multi-factor approach considering forward valuation, earnings growth prospects, Wall Street analysts’ consensus revisions, accounting practices, and various return ratios. It has tested to be highly predictive for identifying the best (most undervalued) and worst (most overvalued) sectors, with a 1-3 month forward look.
Bull Score and Bear Score are based on the price behavior of the underlying stocks on particularly strong and weak days during the prior 40 market days. They reflect investor sentiment toward the stocks (on a relative basis) as either aggressive plays or safe havens. So, a high Bull score indicates that stocks within the ETF have tended recently toward relative outperformance during particularly strong market periods, while a high Bear score indicates that stocks within the ETF have tended to hold up relatively well during particularly weak market periods.
Thus, ETFs with high Bull scores generally perform better when the market is hot, ETFs with high Bear scores generally perform better when the market is weak, and ETFs with high Outlook scores generally perform well over time in various market conditions.
Of course, each ETF has a unique set of constituent stocks, so the sectors represented will score differently depending upon which set of ETFs is used. For Sector Detector, I use ten iShares ETFs representing the major U.S. business sectors.
About Trading Strategies: There are various ways to trade these rankings. First, you might run a sector rotation strategy in which you buy long the top 2-4 ETFs from SectorCast-ETF, rebalancing either on a fixed schedule (e.g., monthly or quarterly) or when the rankings change significantly. Another alternative is to enhance a position in the SPDR Trust exchange-traded fund (SPY) depending upon your market bias. If you are bullish on the broad market, you can go long the SPY and enhance it with additional long positions in the top-ranked sector ETFs. Conversely, if you are bearish and short (or buy puts on) the SPY, you could also consider shorting the two lowest-ranked sector ETFs to enhance your short bias.
However, if you prefer not to bet on market direction, you could try a market-neutral, long/short trade—that is, go long (or buy call options on) the top-ranked ETFs and short (or buy put options on) the lowest-ranked ETFs. And here’s a more aggressive strategy to consider: You might trade some of the highest and lowest ranked stocks from within those top and bottom-ranked ETFs.
