Gradient Insights: Is COVID-driven demand anomalous or sustainable?
 by Rachel Annis
Equity Analyst, Gradient Analytics LLC (a Sabrient Systems company)
“Only time can heal what reason cannot.” – Lucius Annaeus Seneca
In response to the pandemic-driven economic downturn, both Congress and the Federal Reserve have intervened with fiscal and monetary support in the form of direct subsidies, loans, bailouts, tax rebates, supplemental unemployment benefits, ultra-low interest rates, support of capital markets, reduced regulatory constraints, and quantitative easing (QE). The Fed expanded its purchase program beyond Treasury bonds to also include municipal bonds, corporate bonds of both investment and speculative grade, as well as ETFs for the first time. While these policies can raise aggregate demand, employment, and investment in the short run, excess liquidity also supports inefficient firms that otherwise might not survive. The increased prevalence of these firms, as well as the valuation metrics at which their stocks trade can muddy the waters for analysts and thus contribute to a misallocation of capital. These firms also weigh on productivity growth going forward.
Because the downturn was spurred by the pandemic rather than the typical overheated economy and inflation, it has yielded several surprises for investors. For instance, despite unemployment reaching record levels, consumers spent more than expected on home repairs and remodeling which boosted sales at stores like Home Depot (HD) and Lowe’s Companies (LOW). Likewise, residential home sales have surged despite escalating unemployment. An intuitive expectation of an inverse relationship between the two would be incorrect, at least thus far. Outperformance of online retailers, like Amazon.com (AMZN), over some traditional recessionary picks, like Procter & Gamble (PG), has also been unexpected. Moreover, this was the first recession that drove people to spend more time outdoors, giving a boost to firms like sports vehicle maker Polaris (PII). However, the question to ask is: Is this burst of COVID-driven growth anomalous and short-lived, or is it sustainable?
Another aspect to highlight is the conjectural nature of forward estimates and current valuations. The wild swings in near-term consensus estimates between earnings cycles seem to be highly speculative and largely based on the latest news headlines rather than analysis of underlying firms’ fundamental metrics. Similarly, it appears that some previously struggling firms are getting an unsustainable boost by pivoting to create products that help customers deal with COVID-19 impacts. In this article, I explore examples of two firms for which analysts anticipate rising near-term growth rates specifically driven by COVID-19 related tailwinds that we do not believe are sustainable longer-term. Read on....
Fulgent Genetics, Inc. (FLGT): A binary play on ability to rapidly scale COVID-19 test business
The first example involves a firm that pivoted from next generation genetic sequencing to producing tests, both at home and in person, that detect SARS-CoV-2, the virus that causes the novel coronavirus, or COVID-19. On 08/04/20, FLGT announced Q2 2020 sales of $17.3 million which was 72.4% higher than expected and more than double, up 105.0% or $8.8 million, YOY. CFO Paul Kim told investors that 60% of these sales were from COVID-19 tests, meaning that Q2 sales from the legacy business declined 18.0% YOY.
Despite reporting already impressive top line growth, analysts expect that this is just the beginning and the rate of sales growth will accelerate in the near-term. The current consensus estimate implies that in the next twelve months (NTM) sales will increase almost 5x from the current level! Therefore, current valuation metrics already impound massive near-term growth in the business. This becomes problematic when real-world obstacles interrupt the firm on its path to the expected growth rate. The sustainable level of demand for future tests is uncertain, and competitors like Abbott Laboratories (ABT), Co-Diagnostics, Inc. (CODX), and Novacyt S.A. (ALNOV) easily could take market share from FLGT. For instance, ABT is much larger than FLGT, is more well-established, has greater access to capital, and offers COVID tests for just $5.
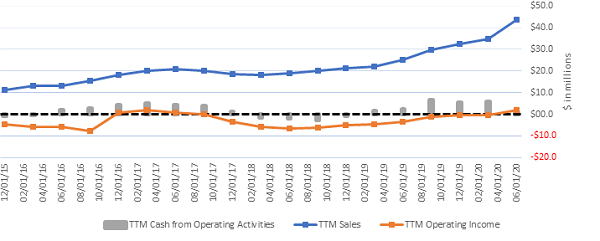
While it is commendable that FLGT was able to adapt to the rapidly changing landscape, sales from COVID tests involve a much lower margin than its legacy next generation sequencing (NGS) products. In Q2 2020, the average selling price per billable test was just $96 and the cost per billable test was $43, yielding a 55.3% gross margin. In contrast, last year the average selling price ($515), cost per test ($221), and gross margin (57.0%) were all significantly higher. Moving down the income statement, FLGT’s operating income has historically fluctuated near or below $0, as shown in Chart 1 below.
Chart 1: FLGT – Five-Year History of Sales, Operating Profit, and Cash from Operations
From an earnings quality perspective, there is evidence that FLGT may have capitalized a higher than normal level of operating expenses. In Q2 2020, prepaid expenses increased 183.8% YOY to $2.9 million, outpacing the rate of growth of adjusted operating expense which increased 90.2% YOY. Therefore, the ratio of prepaid expenses to operating expenses grew to 20.6%, the highest level in the last five years. This is also well above both the level last year and the historically normalized level. Furthermore, FLGT’s earnings could have benefitted from a relative drawdown in the allowance for doubtful accounts (AFDA). In Q2, gross receivables increased 152.8% YOY while the AFDA increased at a slower rate, up 47.7% YOY. Therefore, the AFDA to gross AR metric declined 374 bps YOY to 5.8%, providing another unsustainable source of earnings growth which we estimate around $0.5 million.
I find it particularly concerning that current valuation metrics already reflect the belief that FLGT will be more profitable in the NTM than it ever has been before. Despite the firm’s history of persistent operating losses, the consensus estimate implies that profitability in the NTM will pivot and operating profit will be $65.4 million. In my opinion, this increase of $63.6 million is highly speculative, in part because of the earnings quality issues mentioned above. One risk for a short thesis on FLGT is that if investors myopically focus on rapidly expanding sales, and if operating losses return, then investors might temporarily overlook potential earnings underperformance.
K12 Inc. (LRN): Is COVID-19 related demand temporarily masking underlying weakness in the business?
The next example involves a surge in demand related to COVID-19 that analysts currently do not expect to persist. K12 Inc. (LRN) is a for-profit education company that provides online and blended learning services. The online learning business model is similar to Teladoc Health (TDOC) and its remote doctor consultations. However, just because the education space is ready for a disruption in technology does not mean that companies can rise to the occasion. For instance, LRN’s online platform failed to perform during a critical launch as students returned to school. After working with LRN for over ten years, on 09/10/20 Miami-Dade County Public School District abandoned LRN’s online platform and canceled its $15.3 million contract. A multitude of complaints from both parents and teachers likely drove this decision, and Superintendent Alberto Carvalho directed teachers to use Microsoft Teams and Zoom. While the opening of new schools and the closing/loss of schools is part of the ebb and flow of LRN’s business, this loss is significant because of both the size of the contract as well as the long-term history between the organizations.
Despite losing a major customer, the firm reported impressive double-digit growth in sales driven by demand related to COVID-19. During Q1 FY2021, LRN’s sales grew +44.3% YOY to $371.0 million. However, on 01/27/20 LRN added the revenue stream of adult post-secondary skills training when it bought Galvanize for $165.0 million. Therefore, growth in pro forma sales provides a more accurate apples-to-apples YOY comparison, which increased 38.1% YOY. A surge in demand for online services drove growth as students returned to school amid COVID related concerns. On the Q2 FY2021 Conference Call (10/26/20), CFO Timothy Medina ceded that, “Certainly, COVID-19 has been a strong tailwind for top line growth in enrollments in fiscal 2021.” However, he was reluctant to break out specific figures.
Interestingly, analysts only expect that this level of growth will persist for the next three quarters. Once the COVID-driven surge of demand subsides, analysts predict that sales will contract slightly in Q1 FY2022. This is a sign that there could be issues with sustainable growth. A step up in demand that is new to the business and one-time in nature seems to be temporarily masking underlying weakness as pro forma sales contracted slightly YOY in the two prior consecutive quarters, Q4 and Q3 FY2020. The fact that analysts expect that sales growth will return to a low single digit decline beginning next year, in Q1 FY2022, further supports this view.
During Q1, LRN also introduced its “School-as-a-Service” offering which provides certain online curriculum and services to schools under subscription agreements with an average duration over five years. As discussed in a prior Gradient article last month on Software-as-a-Service (SaaS) contracts, a transition to a subscription model can initially result in lower current period sales. However, for LRN this is a new revenue stream that it created in response to the highly unusual COVID-driven demand. I also found it noteworthy that Q2 was the first time in the last three years that growth in enrollments outpaced sales growth. Consequently, even though the sales per student metric declined YOY, it remained just under the historical high of $2.0 million reached last quarter and 6.9% higher than the trailing seasonal average of $1.8 million.
Regarding the quality of LRN’s earnings, I do not take issue with the overall level of LRN’s receivables or its days sales outstanding (DSO), but the risk profile of its receivables portfolio has deteriorated during the last year. In Q3 FY2020, LRN’s trade receivables increased 56.8% YOY to $419.6 million. However, growth in unbilled receivables vastly outpaced this rate and increased 131.0% YOY to $35.3 million. This represents sales that LRN already reported even though the customer has yet to be billed. Interestingly, in Q1 FY2021 the allowance for doubtful accounts increased 93.3% YOY to $18.5 million. While this does present the current quarter earnings in a conservative light, it is tacit acknowledgment that the receivables currently stored on the balance sheet carry a higher level of risk than normal.
In addition to riskier receivables, LRN’s management has a history of opportunistically increasing investor opacity into the underlying business. On 01/27/20, the SEC sent LRN an inquiry requesting among other things the name of any customers that represent 10% or more of sales, of which LRN had one. On 02/24/20, LRN responded and declined disclosure, saying that if it lost this customer that it would not have a material adverse effect on the business as a whole. GAAP standards only require disclosure of the name if it meets both criteria. Specifically, the firm said, “The Company has had a contract with such entity since 07/01/07 and it represents one of the Company’s longest standing customers. The current contract is set to expire in June 2022, and currently, the Company has no reason to believe that the contract will not be renewed for additional terms.” I find it interesting that LRN believes that the loss of its largest, longest standing customer that provides at least 10% of its sales would not materially move the needle for the business. The excerpt seems to justify the lack of disclosure by saying that the loss is unlikely to happen, which is a different rationale, and noteworthy considering that LRN recently lost a long-standing and significant customer like Miami-Dade. Whatever the reason for its reluctance to provide the customer name, LRN’s explanation illustrates the low level of transparency that the firm prefers.
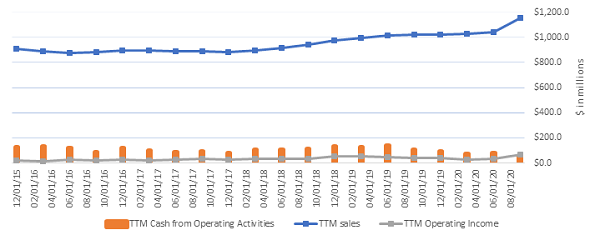
One final note worth mentioning: In the trailing twelve months (TTM), cash flow benefits from growing accounts payable (AP) significantly supported LRN’s cash flow from operating activities (CFOA). During Q1, TTM cash from growth in accounts payable increased $25.3 million YOY to $27.1 million, while TTM CFOA declined 49.3% YOY to $52.7 million. Therefore, AP represented 51.4% of CFOA, which is quite high for an unsustainable source of cash. Chart 2 below illustrates the five-year history of TTM sales, operating profit, and cash flows.
Chart 2: LRN – Five-Year History of Sales, Operating Profit, and Cash from Operations
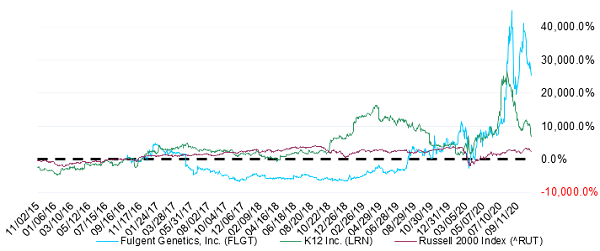
In the two examples above, I highlighted two different firms that have highly speculative near-term growth rates and recently enjoyed unexpected tailwinds in demand from the pandemic. FLGT pivoted to making low margin COVID tests, while LRN experienced a step up in demand as schools began reopening in the fall. Interestingly, analysts expect that LRN’s sales growth will moderate beginning next year in Q1 FY2022, while the growth expected for FLGT is expected to persist into Q2 CY2021. Chart 3 below illustrates, in a 5-year comparison of share prices, the striking recent outperformance of both FLGT and LRN versus the Russell 2000 small cap index. However, despite investor optimism, these valuations appear highly speculative and supported by sales growth that may not persist and could prove to be out of reach beyond the near-term.
Chart 3: Five-Year History of Share Price Performance – FLGT vs. LRN
In summary:
The unprecedentedly severe pandemic-induced recession has been fought off by equally unprecedented fiscal and monetary stimulus, including unlimited liquidity at zero interest rates, which has muddied the water for asset prices leading to much misallocation of capital. At times, asset prices seem to diverge from earnings data, creating wild swings in consensus estimates between earnings announcements in response to the latest headlines. We believe the examples of FLGT and LRN discussed in this article are two such cases. At Gradient Analytics, our analysts continue to carefully evaluate the fundamentals of each firm we analyze and diligently comb through the disclosures in the notes to financial statements to assess the health of the underlying business.
Disclosure: At the time of this writing, among the securities mentioned, the author held a long position in AMZN.
Disclaimer: This newsletter is published solely for informational purposes and is not to be construed as advice or a recommendation to specific individuals. Individuals should take into account their personal financial circumstances in acting on any opinions, commentary, rankings, or stock selections provided by Sabrient Systems or its wholly owned subsidiary, Gradient Analytics. Sabrient Systems makes no representations that the techniques used in its rankings or analysis will result in or guarantee profits in trading. Trading involves risk, including possible loss of principal and other losses, and past performance is no indication of future results.
