Sector Detector: U.S. equities continue to attract capital as long-standing uncertainties abate
Q1 turned out to be one for the ages, and after some extreme moves and bouts of volatility, stocks settled down and closed out the quarter with a flourish. After falling more than -10% from the start of the year until February 11, the S&P 500 was up +6.6% in March, up +13% since February 11, and finished Q1 slightly positive at +0.8% -- and it is up +206% since the depths of March 9, 2009. A combination of oil prices stabilizing, investors getting comfortable with China’s economic growth and its potential impact on the global economy, and a dovish tone from the Fed after the March FOMC meeting have pushed these three all-consuming topics to the back burner. Utilities was the big winner among US sectors for Q1, up about +15%. On the other end of the spectrum, Healthcare was the big loser, down -6%, but within the sector, pharmaceuticals were down -12% and biotechs were roughed up to the tune of -23%.
Besides some notable short-covering in the oil and commodities, there actually has been a discernible move back towards quality, which includes value, GARP (i.e., growth at a reasonable price), and dividend payers. I expect to see more of this as the year progresses.
In this periodic update, I give my view of the current market environment, offer a technical analysis of the S&P 500 chart, review our weekly fundamentals-based SectorCast rankings of the ten U.S. business sectors, and then offer up some actionable ETF trading ideas.
Market overview:
As for Q1 performance, while the S&P 500 was up +0.8%, other developed markets were generally down, with Japan -12.0% and Europe -7.7%. In addition, China was down -15.1% and MSCI World -0.9%, while Brazil was up +15.5% and MSCI emerging markets +5.4%. So, the U.S. is holding up relatively well compared with other developed markets, and in particular it is looking quite solid over the past several weeks. Since the February 11 bottom, the S&P 500 is up about +13%, while semiconductors are up +21%, emerging markets +18%, U.S. small caps +18%, basic materials sector +15%, and transports +15%.
China’s manufacturing PMI came in at 50.2, exceeding 50 for first time since July 2015. Here at home, ISM manufacturing clocked 51.8 and consumer sentiment 91.0, while March non-farm payrolls came in at +215,000, which is the 66th consecutive month of positive job growth. However, new vehicle sales dropped sharply, which has negatively impacted stock prices of automakers like Ford (F), at least for the moment.
Manufacturing output in the United States is at an all-time high, even while the number of manufacturing jobs is shrinking due to higher productivity and automation. But it’s not just the US that has lost such jobs. Globally, millions of manufacturing jobs have been shed due to the same forces. As always, change like this is frightening for people who are on the losing end. But productivity gains remain a positive force for economic development long-term, including higher quality products for lower prices.
Remarkably, Healthcare stocks -- after providing market leadership for a long time -- have been on the avoid-at-all-cost list since last summer, primarily due to the onset of populist election-cycle rhetoric. The biotechs and pharmaceuticals in particular have become downright radioactive in the face of politicians’ assertions of price gouging and the disconcerting revelation that businesses make a lot of money off of the illnesses of others. I suppose it would be far more palatable if drug makers were all non-profits motivated purely by altruism rather than by riches, but the true capitalist would say that we likely would have far fewer and less effective treatments available to us today if that were the case.
Beginning around January 1, 2013, Healthcare in general and biotechs in particular began to greatly outperform, with the iShares NASDAQ Biotech ETF (IBB) up +179% by the time it peaked on July 13, 2015. But since that date, IBB is down -31% and iShares US Pharmaceuticals (IHE) is down -24%, while the broader iShares US Healthcare ETF (IYH) is down about -13% and S&P 500 is down only slightly at -1.7%. Meanwhile, the iShares US Utilities ETF (IDU) is up nearly +16% since last July 13. Nonetheless, some biotechs are now sporting forward P/Es in the low single digits, as investors fear that drug prices will be forced to come down, bringing earnings estimates down, as well.
During Q1, the US dollar fell against a host of currencies, including -9.3% vs. Brazilian real, -7.8% vs. Russian ruble, -6.4% vs. Japanese yen, -6.0% vs. Canadian dollar, -4.8% vs. Aussie dollar, -4.6% vs. Euro, and -0.6% vs. Chinese renminbi. As a reminder, it was August 2011 when the US dollar hit an all-time low while the dollar price of gold hit an all-time high. After that, the dollar continued to flounder about until the Fed’s “taper talk” in May 2013 launched its upward march, which accelerated when the actual tapering of QE bond buying commenced in December 2013, followed two years later by the first fed funds rate hike.
Oil fell -5.1% during Q1, but as with equities, that total performance encompasses quite a wide range, with a big downswing and then a recovery. After closing above $41 on March 22, WTI price has slid and is now trying to hold support at $35. Precious metals have shown strength, as gold was up +16.4% during Q1, silver +11.7%, and copper +2.1%.
While the S&P 500 now provides a 2.17% dividend yield, we can see that the 2-year Treasury yield fell -33 bps during Q1 to 0.72% while the 10-year yield fell -50 bps to 1.77%, indicating a spread of 105 bps. The fed funds futures are now pricing the probability of a quarter-point hike in April at less than 5%, June 26%, September 51%, and by December there is a 66% probability of at least one hike and a 25% chance that we will see two rate hikes by then. But no matter what the Fed does with interest rates, keep in mind that monetary policy remains quite loose as M2 money supply has accelerated.
So, what has so emboldened equity bulls since February 11? Besides the aforementioned stabilization among the trio of big worries: oil prices, China growth, and Fed monetary policy, one can see that U.S. economic reports continue to show improvement, and we can surmise that the anticipated earnings recession for Q1-Q2 already has been priced in, with expectations for better days ahead in the latter part of the year. And then there are the various psychological drivers. For example: 1) lower long-term Treasury yields help support higher equity multiples, 2) investors had become way too bearish, and 3) fear of missing out (aka, panic buying), especially among fund managers tasked with picking stocks in an effort to outperform (or at least keep up with) a benchmark.
The CBOE Market Volatility Index (VIX), aka fear gauge, closed Q1 at 13.95. It then spiked the next morning (Friday) to above 15 before settling down intraday and closing at 13.10 (which is the lowest level since last August). It closed Monday at 14.12 and is holding below 15 and solidly in the zone of complacency (or absence of fear). To be sure, markets for all asset classes tend to overshoot both to the downside and upside, and volatility is no different. Some call this a contrarian timing signal for lower equity prices ahead, and indeed many volatility traders are loading up on VIX options these days. But the other side of the coin is that VIX can stay persistently low for a long time.
Taking all this together, I expect to see a continued flow of global capital into US equities, especially high-quality names with respected products and market position, having solid growth prospects, sound earnings quality, and attractive forward valuations.
SPY chart review:
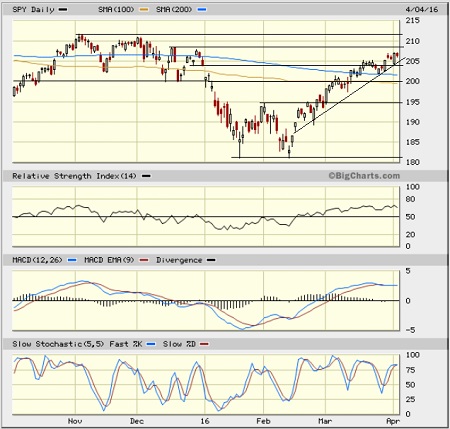
The SPDR S&P 500 Trust (SPY) closed Monday at 206.25 and remains above all its major moving averages. During the depths of fear and uncertainty in mid-February, it formed a double-bottom and bounced strongly from the long-standing and critical support line near 182. In the process, SPY also formed a bullish W-pattern, which needed confirmation via a solid break above the mid-line of the W at the 195 level, which it accomplished after a brief retest of resistance-turned-support. The same thing happened at the 200 price level (corresponding to 100-day simple moving average), where it initially broke out, retested support, and then headed higher to go through the same process at the 200-day SMA and then again after filling the bearish gap from 204. An uptrend line seems to be forming and providing short-term support to the bullish march higher, as shown. I suggested in my article two weeks ago that bulls may be getting a bit tired and may need to let price pull back -- perhaps far enough back to retest the 200-day SMA or even the 200 price level. Oscillators RSI, MACD, and Slow Stochastic remain overbought after a weak attempt to cycle back down. Next resistance levels are 208 and then 212. Notably, the iShares MSCI Emerging Markets (EEM) and iShares Transportation Average (IYT), both of which have been quite strong over the past several weeks, are both retesting support at their 200-day SMAs.
Latest sector rankings:
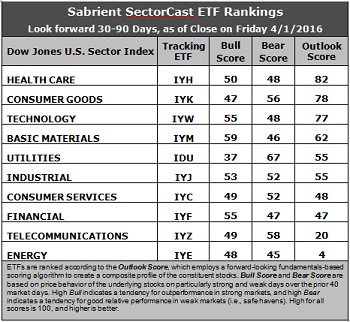
Relative sector rankings are based on our proprietary SectorCast model, which builds a composite profile of each equity ETF based on bottom-up aggregate scoring of the constituent stocks. The Outlook Score employs a forward-looking, fundamentals-based multifactor algorithm considering forward valuation, historical and projected earnings growth, the dynamics of Wall Street analysts’ consensus earnings estimates and recent revisions (up or down), quality and sustainability of reported earnings (forensic accounting), and various return ratios. It helps us predict relative performance over the next 1-3 months.
In addition, SectorCast computes a Bull Score and Bear Score for each ETF based on recent price behavior of the constituent stocks on particularly strong and weak market days. High Bull score indicates that stocks within the ETF recently have tended toward relative outperformance when the market is strong, while a high Bear score indicates that stocks within the ETF have tended to hold up relatively well (i.e., safe havens) when the market is weak.
Outlook score is forward-looking while Bull and Bear are backward-looking. As a group, these three scores can be helpful for positioning a portfolio for a given set of anticipated market conditions. Of course, each ETF holds a unique portfolio of stocks and position weights, so the sectors represented will score differently depending upon which set of ETFs is used. We use the iShares that represent the ten major U.S. business sectors: Financial (IYF), Technology (IYW), Industrial (IYJ), Healthcare (IYH), Consumer Goods (IYK), Consumer Services (IYC), Energy (IYE), Basic Materials (IYM), Telecommunications (IYZ), and Utilities (IDU). Whereas the Select Sector SPDRs only contain stocks from the S&P 500, I prefer the iShares for their larger universe and broader diversity. Fidelity also offers a group of sector ETFs with an even larger number of constituents in each.
Here are some of my observations on this week’s scores:
1. Healthcare has regained the top spot with an Outlook score of 82, as it displays generally solid factor scores across the board, including a low forward P/E (15.4x) and a solid forward long-term annual growth rate (10.8%). Consumer Goods (Staples/Noncyclical) takes the second spot with an Outlook score of 78, as it displays strong sell-side analyst sentiment and the highest return ratios. Technology falls into the third spot but still reflects generally solid scores across the board. Fourth is Basic Materials, which has leapt by 45 points over the past two weeks. Driving its score are the strongest sell-side sentiment (net upgrades to earnings estimates) and strong insider sentiment. Rounding out the top six are Utilities and Industrial. All six have an Outlook score above 50. Notably, Financial still displays the lowest aggregate forward P/E (14.7x), but the sector continues to tumble in the rankings as Wall Street cuts estimates.
2. Energy remains mired firmly at the bottom with an Outlook score of 4 as the sector scores among the worst in all factors of the GARP model, including the highest forward P/E (28.4x). It remains the only sector to display a negative long-term growth rate. Telecom takes the other spot in the bottom two with an Outlook score of 20.
3. Looking at the Bull scores, Basic Materials tops the list with a 59, as short-covering and bottom-fishing kick in on strong market days, while Utilities is the lowest at 37. The top-bottom spread is 22 points, which continues to reflect low sector correlations on strong market days, which is good for stock picking. It is generally desirable in a healthy market to see low correlations reflected in a top-bottom spread of at least 20 points, which indicates that investors have clear preferences in the stocks they want to hold (rather than broad risk-on behavior).
4. Looking at the Bear scores, Utilities (as usual) displays the top score of 67, followed by Telecom at 58, which means that stocks within these sectors have been the preferred safe havens on weak market days. Energy and Basic Materials score the lowest at 45 and 46, respectively, as investors flee during market weakness. The top-bottom spread is 22 points, which reflects low sector correlations on weak market days, which is good for stock picking. Ideally, certain sectors will hold up relatively well while others are selling off (rather than broad risk-off behavior), so it is generally desirable in a healthy market to see low correlations reflected in a top-bottom spread of at least 20 points.
5. Healthcare, Consumer Goods (Staples/Noncyclical), and Technology are bunched together in displaying the best all-around combination of Outlook/Bull/Bear scores, while Energy is the worst. However, looking at just the Bull/Bear combination, defensive sector Telecom is the best, followed by Basic Materials and Industrial, indicating superior relative performance (on average) in extreme market conditions (whether bullish or bearish), while Energy is the worst, followed by Healthcare.
6. This week’s fundamentals-based Outlook rankings still look neutral, with continuing signs of defensiveness given that Consumer Goods (Staples/Noncyclical) and Utilities are in the top five. On the other hand, Technology, Industrial, surprising Basic Materials, and all-weather Healthcare are all in the top six and scoring above 50, which is bullish. Keep in mind, the Outlook Rank does not include timing, momentum, or relative strength factors, but rather is a reflection of the fundamental expectations of individual stocks aggregated by sector.
ETF Trading Ideas:
Our Sector Rotation model, which appropriately weights Outlook, Bull, and Bear scores in accordance with the overall market’s prevailing trend (bullish, neutral, or defensive), reflects a bullish bias and suggests holding Basic Materials, Technology, and Healthcare, in that order. (Note: In this model, we consider the bias to be bullish from a rules-based trend-following standpoint when SPY is above both its 50-day and 200-day simple moving averages.)
Other highly-ranked ETFs in SectorCast from the Basic Materials, Technology, and Healthcare sectors include PowerShares S&P Small Cap Materials Portfolio (PSCM), First Trust NASDAQ Technology Dividend Index Fund (TDIV), and Market Vectors Biotech ETF (BBH).
If you prefer to stick with a neutral bias, the Sector Rotation model suggests holding Healthcare, Consumer Goods (Staples/Noncyclical), and Technology, in that order. On the other hand, if you prefer a defensive stance on the market, the model suggests holding Utilities, Consumer Goods (Staples/Noncyclical), and Telecommunications, in that order.
IMPORTANT NOTE: I post this information periodically as a free look inside some of our institutional research and as a source of some trading ideas for your own further investigation. It is not intended to be traded directly as a rules-based strategy in a real money portfolio. I am simply showing what a sector rotation model might suggest if a given portfolio was due for a rebalance, and I may or may not update the information each week. There are many ways for a client to trade such a strategy, including monthly or quarterly rebalancing, perhaps with interim adjustments to the bullish/neutral/defensive bias when warranted -- but not necessarily on the days that I happen to post this weekly article. The enhanced strategy seeks higher returns by employing individual stocks (or stock options) that are also highly ranked, but this introduces greater risks and volatility. I do not track performance of the ideas mentioned here as a managed portfolio.
Disclosure: Author has no positions in stocks or ETFs mentioned.
Disclaimer: This newsletter is published solely for informational purposes and is not to be construed as advice or a recommendation to specific individuals. Individuals should take into account their personal financial circumstances in acting on any rankings or stock selections provided by Sabrient. Sabrient makes no representations that the techniques used in its rankings or selections will result in or guarantee profits in trading. Trading involves risk, including possible loss of principal and other losses, and past performance is no indication of future results.