Sector Detector: Stocks stuck in neutral as both sides seek a directional catalyst
 The technical picture for stocks has shifted from bearish into neutral, and our fundamentals-based sector rankings appear to have moved from bullish to neutral, as well. Thus, caution remains the order of the day until either the bulls or bears can find a catalyst -- and enough recruits -- to move the ball in their direction.
Notably, there has been a rather significant correction in higher-risk growth stocks and small caps that has not translated into a correction for the broader market. High-P/E and momentum darlings have been slammed. The Russell 2000 small cap index remains well below its important 200-day SMA, and the NASDAQ might test its 200-day soon, too. But the larger S&P 500 and Dow Jones stocks have been holding up just fine as the capital apparently has rotated into defensive and higher quality stocks, offering support to the overall market (e.g, the Wilshire 5000) despite the weakness in the higher-risk segments.
Among the ten U.S. business sectors, Financial and Consumer Goods/Staples were the winners last week. However, on a year-to-date basis, Utilities is still the clear leader, up about +12.5%, followed by the steadily surging Energy at about +7.5%. Healthcare remains in third place, but it has fallen a few percentage points since early March when it held the lead, and is now below +5% YTD. Consumer Services/Discretionary is the clear laggard, and in fact it is the only sector in the red YTD.
The CBOE Market Volatility Index (VIX), a.k.a. fear gauge, closed last week at 12.92, which is right where it closed the previous week. It remains firmly below the 15 threshold, indicating investor complacency about risk in their stock holdings. Although it showed some signs of life last week, VIX remains oversold and could spike up at any time, which would be bearish for stocks.
Despite the Fed’s tapering, its balance sheet has nonetheless ballooned to more than $4.2 trillion and is still growing, which has pushed return-hungry capital into equities. Improved jobs growth, strong manufacturing and services surveys, good data from housing, retail sales, consumer spending, consumer confidence, and the expectation of better earnings growth coming out of the harsh winter -- all of which point to a strengthening economy. Of course, as I have said many times, earnings growth will rely upon actual top-line revenue growth from now on, rather than cost-cutting.
As Q1 earnings reporting season winds down, it appears the market is looking at a forward P/E multiple for the S&P 500 of a little over 16x, which isn’t too rich at this point of the bull market. The 10-year Treasury yield closed Friday at 2.62% and still shows no inclination to rise or fall from here, i.e., there has been neither a widely-anticipated Great Rotation out of bonds (as the Fed tapers bond purchases) nor a massive flight to their safety. And with no sign of wage inflation on the horizon, price inflation is unlikely to surface, either. Thus, longer-term interest rates may continue to confound the experts by remaining low, which supports an elevated P/E multiple in equities.
All in all, whether or not we get a deeper correction to the broad market, the foregoing suggests to me relatively modest but still positive returns this year for the broader market, in contrast to the high-flying, high-correlation, risk-on market of 2013.
SPY chart review:
The SPDR S&P 500 Trust (SPY) closed Friday at 187.96, which is right about where it closed the previous week. The chart looks a lot less ominous, and in fact I would say it has become decidedly neutral, as neither bulls nor bears can get any traction. Overhead resistance is strong, but investors are reluctant to sell. Price is now smack dab in the middle of the long-standing rising bullish channel, and appears to have settled into a tight neutral sideways channel between roughly 186 and 189. Oscillators RSI, MACD, and Slow Stochastic have all settled into neutral, as well, giving no indication of direction.
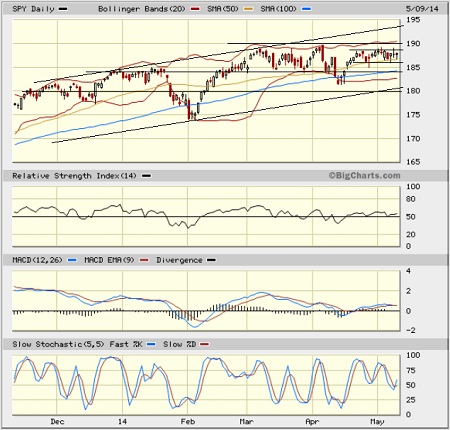
There is still a gap up on April 16 from about 184 that will act as a magnet to be filled and tested. Strong support is being provided by the 50-day simple moving average. After that is the convergence of gap support at 184 with the 100-day SMA. Below that is the bottom of the long-standing uptrend (currently near 181), followed by round-number support at 180, and then the 200-day SMA (near 178).
Latest sector rankings:
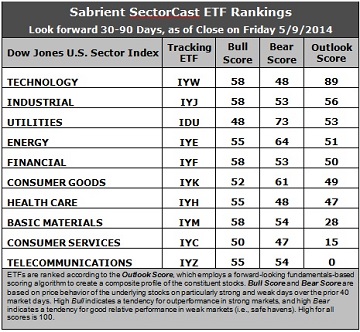
Relative sector rankings are based on our proprietary SectorCast model, which builds a composite profile of each equity ETF based on bottom-up aggregate scoring of the constituent stocks. The “Outlook Score” employs a forward-looking, fundamentals-based multifactor algorithm considering forward valuation, historical and projected earnings growth, the dynamics of Wall Street analysts’ consensus earnings estimates and recent revisions (up or down), quality and sustainability of reported earnings (forensic accounting), and various return ratios. It helps us predict relative performance over the next 1-3 months.
In addition, SectorCast computes a “Bull Score” and “Bear Score” for each ETF based on recent price behavior of the constituent stocks on particularly strong and weak market days. High Bull score indicates that stocks within the ETF recently have tended toward relative outperformance when the market is strong, while a high Bear score indicates that stocks within the ETF have tended to hold up relatively well (“safe havens”) when the market is weak.
Outlook score is forward-looking while Bull and Bear are backward-looking. As a group, these three scores can be helpful for positioning a portfolio for a given set of anticipated market conditions. Of course, each ETF holds a unique portfolio of stocks and position weights, so the sectors represented will score differently depending upon which set of ETFs is used. We use the iShares that represent the ten major U.S. business sectors: Financial (IYF), Technology (IYW), Industrial (IYJ), Healthcare (IYH), Consumer Goods (IYK), Consumer Services (IYC), Energy (IYE), Basic Materials (IYM), Telecommunications (IYZ), and Utilities (IDU). Whereas the Select Sector SPDRs only contain stocks from the S&P 500, I prefer the iShares for their larger universe and broader diversity. Fidelity also offers a group of sector ETFs with an even larger number of constituents in each.
Here are some of my observations on this week’s scores:
1. Technology remains in first place with a robust Outlook score of 89. Industrial stays in second place with a 56. Technology generally displays solid factor scores across the board, with a strong forward long-term growth rate, a reasonable forward P/E, the highest return ratios, and positive sentiment among Wall Street analysts (upward revisions to earnings estimates), along with improving insider sentiment (buying activity). Industrial displays a good forward long-term growth rate, solid return ratios, and strong sentiment among sell-side analysts. Utilities, Energy, and Financial round out the top five.
2. Telecommunications stay in the cellar with an Outlook score of 0 again, as it scores at the bottom in every factor in the model. It is joined in the bottom two once again by Consumer Services/Discretionary with a score of 15.
3. Looking at the Bull scores, four sectors (Tech, Industrial, Financial, and Materials) share the lead at 58, while Utilities is the laggard with a 48 (which shows some improvement). In fact, Utilities is the only sector scoring below 50 this week. The top-bottom spread has shrunk to only 10 points, reflecting relatively higher sector correlations on particularly strong market days. It is generally desirable in a healthy market to see a top-bottom spread of at least 20 points, which indicates that investors have clear preferences in the stocks they want to hold, rather than the all-boats-lifted-in-a-rising-tide mentality that dominated 2013.
4. Looking at the Bear scores, Utilities continues hold up well, scoring 73, which means that stocks within this defensive sector have been the preferred “safe havens” on weak market days. Energy is second at 64. Consumer Services scores the lowest at 47. The top-bottom spread is a robust 26 points, reflecting very low sector correlations on particularly weak market days. Again, it is generally desirable in a healthy market to see a top-bottom spread of at least 20 points.
5. Technology displays by far the best all-weather combination of Outlook/Bull/Bear scores, followed by Utilities. Telecom is the worst, followed closely by Consumer Services. Looking at just the Bull/Bear combination, Utilities is the leader, followed closely by Energy, which actually displays better balance between its Bull and Bear scores, indicating superior relative performance (on average) in extreme market conditions (whether bullish or bearish). Consumer Services scores by far the lowest, indicating general investor avoidance during extreme conditions, and this has been clearly demonstrated by its underperformance so far this year.
6. Overall, I would have to interpret this week’s Outlook rankings as more neutral than bullish. On the one hand, four of the top five sectors also display high Bull scores (the exception is Utilities). But on the other hand, after Technology at the top, the next six sectors are all tightly bunched within a narrow range of only 9 points. It’s just not clear cut.
Nevertheless, these Outlook scores represent the view that Technology and Industrial sectors are relatively undervalued, while Consumer Services and Telecom may be relatively overvalued based on our 1-3 month forward look.
Stock and ETF Ideas:
Our Sector Rotation model, which appropriately weights Outlook, Bull, and Bear scores in accordance with the overall market’s prevailing trend (bullish, neutral, or bearish), suggests holding Technology, Industrial, and Financial in the prevailing bullish climate. (In this particular model, we consider the bias to be bullish from a rules-based standpoint because SPY is still above its 50-day simple moving average while also remaining above its 200-day SMA.)
Other ETFs that are ranked high by our algorithm from the Technology, Industrial, and Financial sectors include iShares PHLX Semiconductor ETF (SOXX), First Trust Industrials/Producer Durables AlphaDEX Fund (FXR), and PowerShares KBW Property & Casualty Insurance Portfolio (KBWP).
For an “enhanced” sector portfolio that enlists top-ranked stocks (instead of ETFs) from within Technology, Industrial, and Energy, some long ideas include Syntel (SYNT), SanDisk Corp (SNDK), Watsco (WSO), Huntington Ingalls Industries (HII), Signature Bank (SBNY), and RenaissanceRe Holdings (RNR). All are ranked highly in the Sabrient Ratings Algorithm and also score within the top quintile of our Earnings Quality Rank (EQR) -- except for the re-insurer RNR, because the Insurance industry is not yet included in the EQR model. EQR is a pure accounting-based risk assessment signal based on the forensic accounting expertise of our subsidiary Gradient Analytics. We have found it quite valuable for helping to avoid performance-offsetting meltdowns in our model portfolios.
However, if you are more comfortable with a neutral bias, the model suggests holding Technology, Industrial, and Utilities. On the other hand, if you have a bearish outlook on the market, the model suggests holding Utilities, Energy, and Consumer Goods/Staples.
Disclosure: Author has no positions in stocks or ETFs mentioned.
Disclaimer: This newsletter is published solely for informational purposes and is not to be construed as advice or a recommendation to specific individuals. Individuals should take into account their personal financial circumstances in acting on any rankings or stock selections provided by Sabrient. Sabrient makes no representations that the techniques used in its rankings or selections will result in or guarantee profits in trading. Trading involves risk, including possible loss of principal and other losses, and past performance is no indication of future results.