Sector Detector: Rejuvenated market seeks follow-through, but earnings loom large
 As I suspected it might, the stock market bounced strongly last week. Weakness the prior week was due in part to traders exiting positions for vacation during the holiday-shortened week, protecting big capital gains, cashing out to pay taxes on capital gains, and “delta hedging” on put options. However, I’m not convinced that the pullback was sufficient to create the great buying opportunity -- but it was sure a tradable bounce.
Among the ten U.S. business sectors, the big winner last week was Energy, which was up about +4.5%. Also, Financial and Industrial were each up about +3%. Defensive sector Utilities still stands alone as the year-to-date leader, up about +11%, while Energy’s strong performance last week has it in second place, up about +5% YTD. Healthcare has been the big loser as it has fallen from the penthouse to the outhouse since the beginning of March, led by the big selloff in momentum favorites from biotech and biopharma.
Wringing out some of the excesses has been healthy for the market overall. I expect that at this stage of the bull run, particularly with the Federal Reserve methodically tapering its liquidity injections, the higher-quality stocks with reasonable forward valuations that were sold off by the momentum traders will recover quickly while the lower-quality speculative stocks that surfed the wave of speculator euphoria will be left behind in a general flight to quality.
Many market commentators are warning of a similar “jobless recovery” as we saw in the 1990s. They lament the sky-high profit margins (that are likely to revert to the mean), growing income inequality, and the predominance of low-paying or part-time jobs among our anemic job growth. Moreover, most new investment and M&A in today’s high-tech society are in intellectual property or capital-intensive (rather than labor-intensive) business – whether new drilling technologies for the energy industry or Facebook’s $19 billion acquisition of WhatsApp (with all of 55 employees).
Thus, many are directing investors’ attention to emerging markets. The MSCI Emerging Markets Index is trading at a forward P/E of around 10.5x, compared with 15.5x for the S&P 500 -- the biggest discount since 2006. Moreover, some of the key emerging market currencies appear severely undervalued, and there’s the potential for significant economic reforms following upcoming elections in many of the key emerging market countries.
Notably, the 10-year Treasury yield bounced from 2.60% during a mid-day dip last Tuesday, and then spiked mid-day on Thursday to close the week at 2.72% as safe haven Treasuries sold off -- at least partially attributed to the EU, U.S., Ukraine, and Russia coming to an agreement in Geneva on steps to address the Ukraine crisis.
Earnings season gets into full swing this week, including McDonald’s (MCD), Apple (AAPL), Netflix (NFLX), AT&T (T), Microsoft (MSFT), Biogen Idec (BIIB), Amazon (AMZN), Starbucks (SBUX), Facebook (FB), and QUALCOMM (QCOM). Last week saw disappointments from Bank of America (BAC), Google (GOOGL) and IBM (IBM), but positive surprises from the likes of Yahoo! (YHOO), General Electric (GE), Intel (INTC), and Morgan Stanley (MS), as well as SanDisk (SNDK), which I have been touting as a top idea in recent articles.
The CBOE Market Volatility Index (VIX), a.k.a. “fear gauge,” closed last week at 13.36, falling significantly on Wednesday-Thursday after closing the prior week above 17. It is back below the 15 threshold, indicating low investor trepidation about their stocks, but it’s notable that there have been many gyrations above and below the 15 threshold so far this year.
SPY chart review:
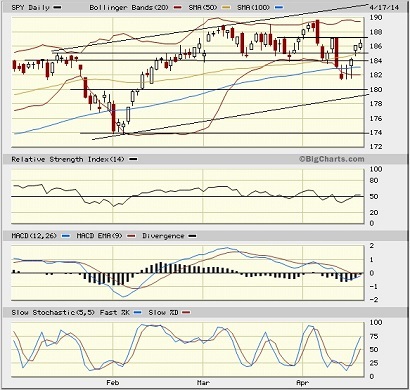
The SPDR S&P 500 Trust (SPY) closed Friday at 186.39. I said last week that the chart had become severely oversold and that bears might struggle to push price any lower in the near term. Indeed, we got a solid bounce, initiated with a bullish inverted hammer candlestick followed by two hammer patterns, which recovered the 100, 50, and 20-day simple moving averages. Now price is contending with prior resistance at 187. With oscillators RSI, MACD, and Slow Stochastic all in the neutral range, price could go either way from here.

Notably, the NASDAQ, Russell 2000, and Dow Jones Industrials are all still negative year-to-date, while the S&P 500 is up less than 1%. However, both the NASDAQ and Russell 2000 bounced strongly from their 200-day simple moving average, which lends support to the notion of a bullish reversal for the overall stock market.
Latest sector rankings:
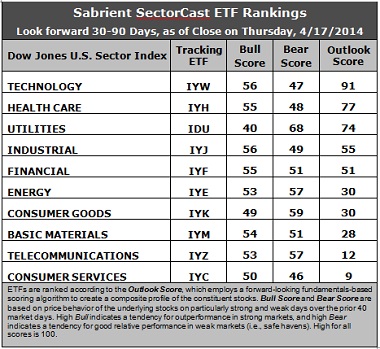
Relative sector rankings are based on our proprietary SectorCast model, which builds a composite profile of each equity ETF based on bottom-up aggregate scoring of the constituent stocks. The “Outlook Score” employs a forward-looking, fundamentals-based multifactor algorithm considering forward valuation, historical and projected earnings growth, the dynamics of Wall Street analysts’ consensus earnings estimates and recent revisions (up or down), quality and sustainability of reported earnings (forensic accounting), and various return ratios. It helps us predict relative performance over the next 1-3 months.
In addition, SectorCast computes a “Bull Score” and “Bear Score” for each ETF based on recent price behavior of the constituent stocks on particularly strong and weak market days. High Bull score indicates that stocks within the ETF recently have tended toward relative outperformance when the market is strong, while a high Bear score indicates that stocks within the ETF have tended to hold up relatively well (“safe havens”) when the market is weak.
Outlook score is forward-looking while Bull and Bear are backward-looking. As a group, these three scores can be helpful for positioning a portfolio for a given set of anticipated market conditions. Of course, each ETF holds a unique portfolio of stocks and position weights, so the sectors represented will score differently depending upon which set of ETFs is used. We use the iShares that represent the ten major U.S. business sectors: Financial (IYF), Technology (IYW), Industrial (IYJ), Healthcare (IYH), Consumer Goods (IYK), Consumer Services (IYC), Energy (IYE), Basic Materials (IYM), Telecommunications (IYZ), and Utilities (IDU). Whereas the Select Sector SPDRs only contain stocks from the S&P 500, I prefer the iShares for their larger universe and broader diversity. Fidelity also offers a group of sector ETFs with an even larger number of constituents in each.

Here are some of my observations on this week’s scores:
1. The top four remain the same this week. Technology remains in first place with a robust Outlook score of 91. Anything above 90 is quite strong. Healthcare stays in second place with a score of 77. Technology generally displays solid factor scores across the board, with a strong forward long-term growth rate, a reasonable forward P/E, the highest return ratios, and positive sentiment among Wall Street analysts (upward revisions to earnings estimates). Healthcare displays a strong forward long-term growth rate, a reasonable forward P/E, and strong sentiment among both sell-side analysts (earnings revisions) and company insiders (open-market buying). Utilities is in third at 74 followed by Industrial at 55. The top four sectors are the only ones receiving solidly positive earnings revisions. Rounding out the top five is Financial, which is back above 50 in its Outlook score.
2. Consumer Services stays in the cellar with an Outlook score of 9, even though it has the highest forward long-term growth rate. Telecommunications is in the bottom two with a score of 12 as it displays generally low scores across the board.
3. Looking at the Bull scores, Technology and Industrial share the lead with a score of 56, while Utilities is by far the laggard with a low score of 40. The top-bottom spread is 16 points, reflecting low sector correlations on particularly strong market days. It is generally desirable in a healthy market to see a top-bottom spread of at least 20 points, which indicates that investors have clear preferences in the stocks they want to hold, rather than the “all-boats-lifted-in-a-rising-tide” mentality that we saw during 2013.
4. Looking at the Bear scores, Utilities is the clear leader with a 68, which means that stocks within this defensive sector have been the preferred “safe havens” on weak market days. Consumer Services score the lowest at 46. The top-bottom spread is a robust 22 points, reflecting low sector correlations on particularly weak market days. Again, it is generally desirable in a healthy market to see a top-bottom spread of at least 20 points.
5. Technology displays the best all-weather combination of Outlook/Bull/Bear scores, while Consumer Services is the worst. Looking at just the Bull/Bear combination, Telecom and Energy are the leaders, indicating superior relative performance (on average) in extreme market conditions (whether bullish or bearish), while Consumer Services scores by far the lowest, indicating general investor avoidance during extreme conditions.
6. Overall, I would say that this week’s rankings are looking slightly bullish again. Technology, Healthcare, Industrial, and Financial all display strong Bull scores, and they are all ranked in the top five Outlook scores. On the other hand, defensive sector Utilities remains inordinately strong. Nevertheless, the other defensive sectors having the higher Bear scores (i.e., Consumer Goods, Energy, and Telecom) are among the bottom five Outlook scores.
These Outlook scores represent the view that Technology and Healthcare sectors are relatively undervalued, while Consumer Services and Telecom may be relatively overvalued based on our 1-3 month forward look.
Stock and ETF Ideas:
Our Sector Rotation model, which appropriately weights Outlook, Bull, and Bear scores in accordance with the overall market’s prevailing trend (bullish, neutral, or bearish), suggests holding Technology, Healthcare, and Industrial in the prevailing bullish climate. (In this particular model, we consider the bias to be bullish from a rules-based standpoint because SPY has risen back above its 50-day simple moving average while also remaining above its 200-day SMA.)
Other ETFs that are ranked high by our algorithm from the Technology, Healthcare, and Industrial sectors include Technology Select Sector SPDR (XLK), Market Vectors Pharmaceutical ETF (PPH), and First Trust Industrials/Producer Durables AlphaDEX Fund (FXR).
For an “enhanced” sector portfolio that enlists top-ranked stocks (instead of ETFs) from within Tech, Healthcare, and Industrial, some long ideas include Xilinx (XLNX), Riverbed Technology (RVBD), Salix Pharmaceuticals (SLXP), Allergan (AGN), L-3 Communications (LLL), and Engility Holdings (EGL). All are ranked highly in the Sabrient Ratings Algorithm and also score within the top quintile of our Earnings Quality Rank (EQR), which is a pure accounting-based risk assessment signal based on the forensic accounting expertise of our subsidiary Gradient Analytics. We have found EQR quite valuable for helping to avoid performance-offsetting meltdowns in our model portfolios.
However, if you are more comfortable with a neutral bias, the model suggests holding Technology, Healthcare, and Utilities. On the other hand, if you have a bearish outlook on the market, the model suggests holding Technology, Utilities, and Consumer Goods/Staples.
Disclosure: Author has no positions in stocks or ETFs mentioned.
Disclaimer: This newsletter is published solely for informational purposes and is not to be construed as advice or a recommendation to specific individuals. Individuals should take into account their personal financial circumstances in acting on any rankings or stock selections provided by Sabrient. Sabrient makes no representations that the techniques used in its rankings or selections will result in or guarantee profits in trading. Trading involves risk, including possible loss of principal and other losses, and past performance is no indication of future results.
