Sector Detector: Fed reiterates its role as Mr. Market’s trusty sidekick
 Like any superhero or action movie star who relies upon a “trusty sidekick,” Mr. Market stays strong, confident, and bold with the Federal Reserve at his side. Chairman Bernanke (and heir apparent Janet Yellen) firmly believes that the wealth effect provided by rising stock and housing markets is essential for maintaining consumer spending and corporate earnings growth.
After five straight market advances, a 7% rise in the past two weeks, and all ten U.S. business sector more than two standard deviations above their 50-day simple moving averages, there is no doubt the market has been on a roll and due for a rest...and perhaps a meaningful pullback or consolidation. But when? And how far?
ConvergEx brought up this week in a Morning Briefing the irony that the number of food stamp recipients has hit record highs (15% of the U.S. population) at the same time that stocks keep hitting new record highs. Nevertheless, investors still see more that is encouraging than discouraging, with the central banks keeping liquidity flowing (“Don’t fight the Fed!”), improving economic data, unwinding of elevated short interest, corporate earnings at record highs, and M&A and share buybacks, e.g., IBM (IBM).
Only corporate revenue growth has remained somewhat disappointing, and forward guidance has been iffy. With the forward P/E on the S&P 500 around 15, some are thinking that we are at the upper limits of what multiple expansion can support without real top-line growth. But with low inflation and interest rates, an elevated P/E is justified. Although volume remains anemic, this appears to be the new reality of this steadily rising market, along with low volatility. The CBOE Market Volatility Index (VIX), a.k.a. “fear gauge,” closed Wednesday at 13.65, which is about where it was last Wednesday and still near its historic lows.
Moreover, there are still huge stockpiles of cash on the sidelines whose owners are regretting not having participated in the stock market rally. We have passed the 5-year anniversary of the 2008 meltdown, with no sign of weakness anywhere.
My hope at this point in the market rally is that the “junk rally” phase, led by lower quality companies, is ready to give way to appropriate leadership from the strongest and highest quality firms.
The SPY chart: The SPDR S&P 500 Trust (SPY) closed Wednesday at 176.29, after hitting yet another all-time high at the open. It remains well above all its major simple moving averages as bulls have been reluctant to allow the necessary technical consolidation. Last week, I drew on the chart two bullish channels, and both remain in play -- one started back in November of last year, and the other began in May of this year. Price is continuing to struggle with resistance from the upper line of both channels, while oscillators like RSI, MACD, and Slow Stochastic are now even more overbought than they were last week.
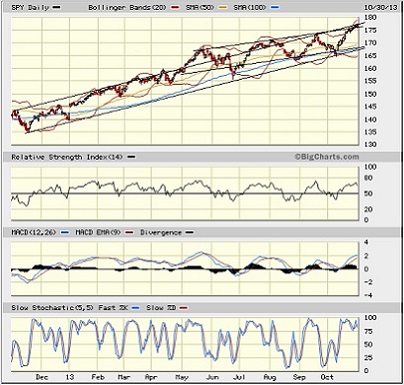
Moreover, the Bollinger Bands are stretched quite wide. The need for technical consolidation before the next up leg is even greater this week, which is likely why the market fell on Wednesday. When the inevitable pullback occurs, the 170 price level and 50-day simple moving average should both serve as strong support from which to launch a rally into the New Year.
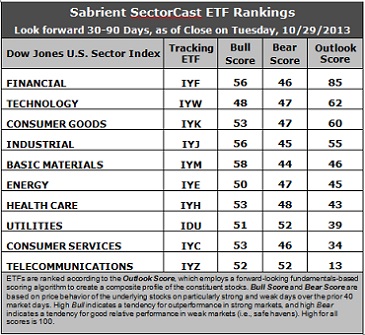
Latest rankings: The table ranks each of the ten U.S. business sector iShares ETFs by Sabrient's proprietary Outlook Score, which employs a forward-looking, fundamentals-based, quantitative algorithm to create a bottom-up composite profile of the constituent stocks within the ETF. The multi-factor model considers forward valuation, historical earnings trends, earnings growth prospects, the dynamics of Wall Street analysts' consensus estimates, accounting practices and earnings quality, and various return ratios. In addition, the table also shows Sabrient's proprietary Bull Score and Bear Score for each ETF.
High Bull score indicates that stocks within the ETF have tended recently toward relative outperformance during particularly strong market periods, while a high Bear score indicates that stocks within the ETF have tended to hold up relatively well during particularly weak market periods. Bull and Bear are backward-looking indicators of recent sentiment trend.
As a group, these three scores can be quite helpful for positioning a portfolio for a given set of anticipated market conditions.
Observations:
1. Financial (IYF) moves to the top spot this week with an Outlook score of 85. IYF displays the lowest forward P/E, and the most positive sentiment among both Wall Street analysts and company insiders (i.e., open-market buying). Technology (IYW) falls to second place as its Outlook score plummeted 33 points, from 95 down to 62. Although IYW still displays one of the lowest forward P/Es, one of the strongest long-term forward growth rates, and the best return ratios, sentiment has suddenly soured among Wall Street analysts and insiders, alike. In third place with a score of 60 is Consumer Goods (IYK), followed by Industrial (IYJ), which continues to rise, and then Basic Materials (IYM).
2. Like IYW, Energy (IYE) lost support among insiders and analysts, which caused it to drop by 20 points in its Outlook score and fall to sixth place. Energy and Technology got hammered the hardest by reductions in sell-side earnings estimates.
3. Telecom (IYZ) is in the cellar yet again with an Outlook score of 13. IYZ remains weak in most factors across the board, including a high forward P/E, low return ratios, and a modest projected long-term growth rate. However, sentiment among insiders and Wall Street analysts is somewhat better than some of the other sectors, so all is not lost. Consumer Services (IYC) returns to the bottom two with a score of 34.
4. This week’s fundamentals-based rankings saw some shuffling but still reflect a solidly bullish bias, as Tech and Financial sit at the top, Basic Materials holds its ground, and Industrial continues to rise, while defensive sectors like Telecom, Healthcare, and Utilities stay in the bottom four. If Consumer Goods and Consumer Services were to swap places, the rankings would look overwhelmingly bullish.
5. Looking at the Bull scores, Basic Materials (IYM) has been the leader on particularly strong market days, scoring 58. Surprisingly, Technology (IYW) is the only one scoring under 50, coming in at 48. The top-bottom spread is only 10 points, which indicates relatively high sector correlations (all-boats-lifted buying) on particularly strong market days.
6. Looking at the Bear scores, Utilities (IDU) and Telecom (IYZ) hold the top spot as favorite “safe haven” on weak market days, scoring 52, which isn’t a particularly high score, so there isn’t a lot of conviction there. However, they are the only two that score above 50. Basic Materials (IYM) displays the lowest Bear score of 44. The top-bottom spread is only 8 points, which indicates relatively low sector correlations (across-the-board selling) on particularly weak market days.
These Outlook scores represent the view that Financial and Technology sectors are still relatively undervalued, while Telecom and Consumer Services may be relatively overvalued based on our 1-3 month forward look.
Other top-ranked ETFs within Financial and Techology sectors include the PowerShares KBW Insurance Portfolio (KBWI) and the iShares Global Tech ETF (IXN). Some top-ranked stocks from Financial and Tech sectors include Everest Re Group (RE), Signature Bank (SBNY), CommVault Systems (CVLT), and Google (GOOG). Each of these ranks highly in the Sabrient Ratings Algorithm, and most also score in the top two quintiles (i.e., lowest accounting-based risk) in our proprietary Earnings Quality Rank.
The Earnings Quality Rank (EQR) is a pure accounting-based risk assessment signal co-developed by Sabrient and subsidiary Gradient Analytics, a forensic accounting research firm. Our clients (including institutional portfolio managers and analysts, hedge funds, and wealth managers) use it to avoid meltdowns in long positions and to identify short candidates.
For example, EQR is a key factor in Sabrient’s “Baker’s Dozen” model. The annual portfolio based on this model is now up +39% since the portfolio’s inception on January 11 through October 30, vs. the S&P 500 return of +20% over the same timeframe. Moreover, all 13 stocks are comfortably positive and 12 are up by double digits, led by Genworth Financial (GNW), Jazz Pharmaceuticals (JAZZ), Ocwen Financial (OCN), EPL Oil & Gas (EPL), Seagate Technology (STX), and Alaska Air Group (ALK). There have been no offsetting meltdowns, and we believe our Earnings Quality Rank is a primary reason.
Disclosure: Author has no positions in stocks or ETFs mentioned.
About SectorCast: Rankings are based on Sabrient’s SectorCast model, which builds a composite profile of each equity ETF based on bottom-up aggregate scoring of the constituent stocks. The Outlook Score employs a fundamentals-based multi-factor approach considering forward valuation, earnings growth prospects, Wall Street analysts’ consensus revisions, accounting practices, and various return ratios. It has tested to be highly predictive for identifying the best (most undervalued) and worst (most overvalued) sectors, with a 1-3 month forward look.
Bull Score and Bear Score are based on the price behavior of the underlying stocks on particularly strong and weak days during the prior 40 market days. They reflect investor sentiment toward the stocks (on a relative basis) as either aggressive plays or safe havens. So, a high Bull score indicates that stocks within the ETF have tended recently toward relative outperformance during particularly strong market periods, while a high Bear score indicates that stocks within the ETF have tended to hold up relatively well during particularly weak market periods.
Thus, ETFs with high Bull scores generally perform better when the market is hot, ETFs with high Bear scores generally perform better when the market is weak, and ETFs with high Outlook scores generally perform well over time in various market conditions.
Of course, each ETF has a unique set of constituent stocks, so the sectors represented will score differently depending upon which set of ETFs is used. For Sector Detector, I use ten iShares ETFs representing the major U.S. business sectors.
About Trading Strategies: There are various ways to trade these rankings. First, you might run a sector rotation strategy in which you buy long the top 2-4 ETFs from SectorCast-ETF, rebalancing either on a fixed schedule (e.g., monthly or quarterly) or when the rankings change significantly. Another alternative is to enhance a position in the SPDR Trust exchange-traded fund (SPY) depending upon your market bias. If you are bullish on the broad market, you can go long the SPY and enhance it with additional long positions in the top-ranked sector ETFs. Conversely, if you are bearish and short (or buy puts on) the SPY, you could also consider shorting the two lowest-ranked sector ETFs to enhance your short bias.
However, if you prefer not to bet on market direction, you could try a market-neutral, long/short trade—that is, go long (or buy call options on) the top-ranked ETFs and short (or buy put options on) the lowest-ranked ETFs. And here’s a more aggressive strategy to consider: You might trade some of the highest and lowest ranked stocks from within those top and bottom-ranked ETFs.