Sector Detector: Bulls look to central banks for support
 Bulls have refused to let the market break down. Last week, the ECB’s Mario Draghi came to the rescue by pledging to do “whatever it takes” to support the euro, which launched a big rally to close the week. Still, investors have been eagerly anticipating an announcement of something more concrete, like some bold new action from the central banks, i.e., more global liquidity. After all, it has been such stimulus that has driven all periods of market strength since the March 2009 V-bottom.
The FOMC on Wednesday provided no comments regarding a QE3, and there was some mild disappointment. So, next up are the ECB and Bank of England. This reminds me that the next edition of The MacroReport will be released imminently by Sabrient, this time focusing on Central Banks. Also, be sure to visit MacroReport Interactive while it is still available at no charge. The information can help you position a portfolio for various macroeconomic scenarios, with lists of “Quick Response” U.S. stocks that tend to thrive, as well as stocks to avoid, in a given macro-variable trend:
http://www.sabrient.com/macroreport/QuickResponse-Portfolios/overview.php
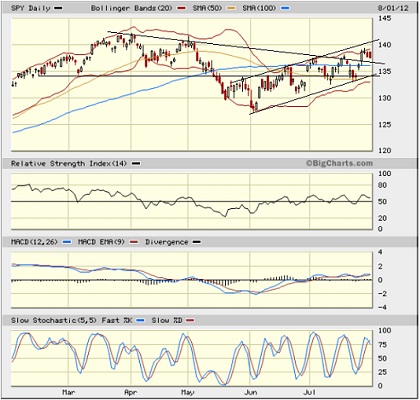
SPY closed Wednesday at 137.59, after bouncing last week from the convergence of the bottom of the bullish rising channel, the 50-day simple moving average, and a previous support level at 134. It also broke convincingly above the upper line of the neutral symmetrical triangle and remains above both the 50-day and 100-day simple moving averages and firmly in the middle of its rising channel. It’s all nicely bullish, but in need of more volume.

The VIX (CBOE Market Volatility Index—a.k.a. “fear gauge”) closed Wednesday at 18.96, which is comfortably below the 20 level, although it touched slightly above 20 on Monday. No discernible fear expressed here.
Worth mentioning, however, is that the late July rally was led by defensive sectors like Utilities, Consumer Staples and Healthcare, which is admittedly a bit concerning.
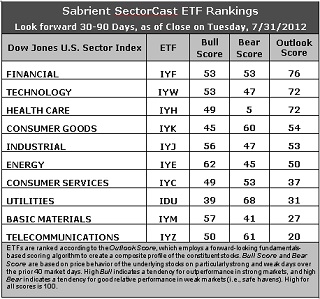
Latest rankings: The table ranks each of the ten U.S. industrial sector iShares (ETFs) by Sabrient’s proprietary Outlook Score, which employs a forward-looking, fundamentals-based, quantitative algorithm to create a bottom-up composite profile of the constituent stocks within the ETF. In addition, the table also shows Sabrient’s proprietary Bull Score and Bear Score for each ETF.
High Bull score indicates that stocks within the ETF have tended recently toward relative outperformance during particularly strong market periods, while a high Bear score indicates that stocks within the ETF have tended to hold up relatively well during particularly weak market periods. Bull and Bear are backward-looking indicators of recent sentiment trend.
As a group, these three scores can be quite helpful for positioning a portfolio for a given set of anticipated market conditions.

Observations:
1. Financial (IYF) retains the top spot with an Outlook score of 76. Stocks within IYF are getting good analyst support and insider buying, and they have relatively low forward P/Es. Technology (IYW) is in the second spot with a 72. Stocks within IYW are displaying relatively low forward P/Es, as well, along with strong return ratios.
2. Healthcare (IYH) also scores a 72, while Consumer Goods (IYK) rises to fourth place. These rankings have stabilized on the bullish side of the fence after looking more cautious last week. Six of the ten sectors are scoring 50 or higher, which is bullish, but Consumer Services (IYC) and Materials (IYM) remain well below 50, which is not so bullish.
3. Telecom (IYZ) stays at the bottom of the Outlook rankings this week with an Outlook score of 20. However, its score has been rising a bit as Wall Street has been supportive and their long-term growth projections have increased, although it remains saddled with the highest (worst) forward P/E and the worst return ratios. Basic Materials (IYM) continues to drop as Wall Street analysts have been hammering stocks within the sector with reduced earnings estimates.
4. Looking at the Bull scores, Energy (IYE) is the clear leader on strong market days, scoring 62. Utilities (IDU) is still by far the weakest on strong days, scoring 39. In other words, Energy stocks have tended to perform the best when the market is rallying, while Utilities stocks have lagged.
5. Looking at the Bear scores, Utilities (IDU) remains the strong investor favorite “safe haven” on weak market days, scoring 68. Although Materials (IYM) is an investor favorite on strong market days, the sector has been abandoned (relatively speaking) by investors during market weakness, as reflected by its low Bear score of 41. In other words, Materials stocks have tended to sell off the most when the market is pulling back, while Utilities stocks have held up the best.
6. Overall, Financial (IYF) shows the best all-weather combination of Outlook/Bull/Bear scores. Adding up the three scores gives a total of 182. Materials (IYM) is the worst at 125, and it also displays the worst combination of Bull/Bear with a 98. Telecom (IYZ) displays the best Bull/Bear of 111.
These scores represent the view that the Financial and Technology sectors may be relatively undervalued overall, while Telecom and Materials sectors may be relatively overvalued, based on our 1-3 month forward look.
Top-ranked stocks within Financial and Technology sectors include Altisource Portfolio Solutions (ASPS), BB&T Corp (BBT), Seagate Technology (STX), and Apple Inc. (AAPL). After disappointing in the latest earnings announcement, Apple is back above $600 as investors just can’t do without the stock for very long.
Disclosure: Author has no positions in stocks or ETFs mentioned.
About SectorCast: Rankings are based on Sabrient’s SectorCast model, which builds a composite profile of each equity ETF based on bottom-up scoring of the constituent stocks. The Outlook Score employs a fundamentals-based multi-factor approach considering forward valuation, earnings growth prospects, Wall Street analysts’ consensus revisions, accounting practices, and various return ratios. It has tested to be highly predictive for identifying the best (most undervalued) and worst (most overvalued) sectors, with a one-month forward look.
Bull Score and Bear Score are based on the price behavior of the underlying stocks on particularly strong and weak days during the prior 40 market days. They reflect investor sentiment toward the stocks (on a relative basis) as either aggressive plays or safe havens. So, a high Bull score indicates that stocks within the ETF have tended recently toward relative outperformance during particularly strong market periods, while a high Bear score indicates that stocks within the ETF have tended to hold up relatively well during particularly weak market periods.
Thus, ETFs with high Bull scores generally perform better when the market is hot, ETFs with high Bear scores generally perform better when the market is weak, and ETFs with high Outlook scores generally perform well over time in various market conditions.
Of course, each ETF has a unique set of constituent stocks, so the sectors represented will score differently depending upon which set of ETFs is used. For Sector Detector, I use ten iShares ETFs representing the major U.S. business sectors.
About Trading Strategies: There are various ways to trade these rankings. First, you might run a sector rotation strategy in which you buy long the top 2-4 ETFs from SectorCast-ETF, rebalancing either on a fixed schedule (e.g., monthly or quarterly) or when the rankings change significantly. Another alternative is to enhance a position in the SPDR Trust exchange-traded fund (SPY) depending upon your market bias. If you are bullish on the broad market, you can go long the SPY and enhance it with additional long positions in the top-ranked sector ETFs. Conversely, if you are bearish and short (or buy puts on) the SPY, you could also consider shorting the two lowest-ranked sector ETFs to enhance your short bias.
However, if you prefer not to bet on market direction, you could try a market-neutral, long/short trade—that is, go long (or buy call options on) the top-ranked ETFs and short (or buy put options on) the lowest-ranked ETFs. And here’s a more aggressive strategy to consider: You might trade some of the highest and lowest ranked stocks from within those top and bottom-ranked ETFs, such as the ones I identify above.
