Sector Detector: Bulls look to awaken sleepy market … before the bears do
 Anxious bulls no doubt are looking for ways to rustle awake this sleepy late-summer stock market, before the bears stealthily bring it down. Investors’ focus has been on the Fed and what it might do next month, and Wednesday’s release of the July FOMC meeting minutes showed almost all the voting members supported no change in stimulus, with only a few hawks insisting that tapering should begin sooner. But with such low trading volumes, bulls are having a tough time overcoming investor paralysis.
And it hasn’t helped that Egypt is imploding while the likes of corporate bellwethers Cisco (CSCO) and Wal-Mart (WMT) have issued disappointing earnings reports. Wal-Mart is particularly concerning because it reflects the confidence and wealth mindset of the average American consumer.
Fear and greed are the two key drivers of human behavior. Bulls rely on greed (plus fear of “missing out”), while bears rely on fear (plus the greed of short-sellers). Fear at this stage of the market’s impressive rise manifests in anxiety and paralysis and giving an ear to obscure theories like the mysterious Hindenburg Omen -- whose mathematical complexity alone strikes fear in the hearts of otherwise unflappable traders.
Since May 1, the 10-year Treasury yield has jumped from 1.64% to 2.86% (a 74% rise). And as both US and foreign capital has poured out of US Treasuries in anticipation of Fed tapering of its bond-buying (which has kept longer-term interest rates low), you might think that stocks would be the beneficiaries of that money seeking a new home. But, while the S&P 500 has gone up about 3.7% since May 1, much of the cash seems to be finding its way into International equities…at least for the moment.
But the positives for US stocks still outweigh the negatives. Interest rates are still low despite their recent jump. The economy is gradually improving. Third and fourth quarter earnings guidance is mostly higher. And of course, the Fed is not going to abandon us. Pullbacks are still buying opportunities.
The SPDR S&P 500 Trust (SPY) closed Wednesday at 164.56. It gapped down last Thursday and has remained weak despite a brief bounce on Tuesday. After struggling at the 170 mark (which corresponds to 1700 on the S&P 500), the bulls evidently decided to let the bears have their mean reversion and retest of the 50-day simple moving average. Wednesday’ action puts the 100-day SMA in play now, while the 200-day SMA is quite a bit lower, down around 156. Oscillators RSI, MACD, and Slow Stochastic all look oversold now, and in fact MACD is looking much like it did at the SPY’s June reversal point.
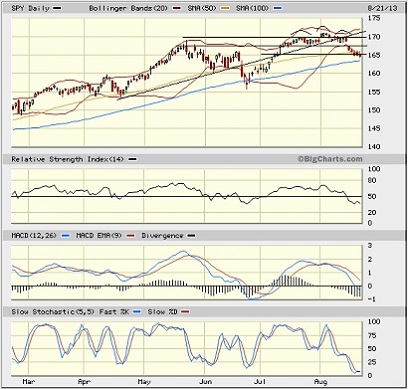
Also, I suggested last Wednesday that the right shoulder of a head-and-shoulders top might be forming, and it indeed confirmed the very next day. With the neckline around prior support at 167.5 and the head peaking at 170, the downside price projection of this shallow formation is around 165, which also corresponds with the price gap from July 11 (which was serving as something of a magnet and now has been filled). So, the correction could end right here, or perhaps slightly lower like the 100-day SMA.
The CBOE Market Volatility Index (VIX), a.k.a. “fear gauge,” closed Wednesday at 15.94, which is a big jump from its recent lows around 13 and above the 15 threshold for the first time since the market recovered from its June swoon. As I suggested last week, VIX was overdue for some mean reversion, along with a brief pullback in equities.
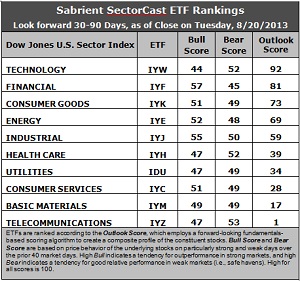
Latest rankings: The table ranks each of the ten U.S. business sector iShares ETFs by Sabrient's proprietary Outlook Score, which employs a forward-looking, fundamentals-based, quantitative algorithm to create a bottom-up composite profile of the constituent stocks within the ETF. The multi-factor model considers forward valuation, historical earnings trends, earnings growth prospects, the dynamics of Wall Street analysts' consensus estimates, accounting practices and earnings quality, and various return ratios. In addition, the table also shows Sabrient's proprietary Bull Score and Bear Score for each ETF.
High Bull score indicates that stocks within the ETF have tended recently toward relative outperformance during particularly strong market periods, while a high Bear score indicates that stocks within the ETF have tended to hold up relatively well during particularly weak market periods. Bull and Bear are backward-looking indicators of recent sentiment trend.
As a group, these three scores can be quite helpful for positioning a portfolio for a given set of anticipated market conditions.
Observations:
1. Technology (IYW) remains in the top spot with a robust Outlook score of 92. Anything above 90 in the SectorCast model is impressive. IYW displays a low forward P/E, a solid long-term projected growth rate, and the best return ratios. Also, Wall Street is beginning to show some support in the form of positive net revisions to earnings estimates. Financial (IYF) takes the second spot once again with a score of 81 as it continues to display a low forward P/E, strong insider sentiment, and earnings upgrades from the sell-side analysts. Consumer Goods (IYK) remains in third place with an Outlook score of 73, while Energy (IYE) and Industrial (IYJ) round out the top five.
2. Telecom (IYZ) stays in the cellar yet again with a low Outlook score of 1. IYZ is weak in all factors across the board, including a high forward P/E, low return ratios, poor insider sentiment, modest long-term projected growth, and extremely negative Wall Street sentiment in the form of earnings downgrades. Also in the bottom two again this week is Basic Materials (IYM) with a score of 17, as earnings within the sector continue to be downgraded by the sell-side.
3. This week’s fundamentals-based rankings have strengthened their bullish bias, IMHO, with Technology, Financial, Energy, and Industrial in the top five. Iin fact, each of the top five saw increased Outlook scores with each scoring well above 50. We can now observe a two-tier ranking, as the top five have strengthened their Outlook scores while the bottom five have largely seen reduced scores, and there is a 20-point gap separating the two tiers.
4. Looking at the Bull scores, IYF has been the leader on particularly strong market days, scoring 57, while Technology (IYW) scores the lowest at 44. The top-bottom spread is 13 points, indicating falling equity correlations on particularly bullish market days, which is a positive sign to me, indicating investor preferences for certain sectors rather than an “all boats lifted” mentality.
5. Looking at the Bear scores, IYZ is now the favorite “safe haven” on weak market days, scoring 53, while long-time favorite Utilities (IDU) remains below 50 -- which indicates to me bullish investor sentiment and a lack of fear. IYF displays the worst performance during extreme market weakness as reflected in the low Bear score of 45. The top-bottom spread is a narrow 8 points, indicating relatively high sector correlations on particularly weak market days, i.e., across-the-board selling during extreme market weakness.
6. Overall, ITW shows the best all-weather combination of Outlook/Bull/Bear scores. Adding up the three scores gives a total of 188. IYZ is the by far the worst at 101. Looking at just the Bull/Bear combination, IYJ displays the highest score of 105, which indicates good relative performance in extreme market conditions (whether bullish or bearish), while IDU and IYW score the lowest at 96, which indicates investor avoidance during extreme conditions.
These Outlook scores represent the view that Technology and Financial sectors are still relatively undervalued, while Telecom and Basic Materials sectors may be relatively overvalued based on our 1-3 month forward look.
Some top-ranked stocks within IYW and IYF that look good to me this week include Apple Inc. (AAPL), VMware (VMW), Mastercard (MA), and Prosperity Bancshares (PB).
Disclosure: Author has no positions in stocks or ETFs mentioned.
About SectorCast: Rankings are based on Sabrient’s SectorCast model, which builds a composite profile of each equity ETF based on bottom-up aggregate scoring of the constituent stocks. The Outlook Score employs a fundamentals-based multi-factor approach considering forward valuation, earnings growth prospects, Wall Street analysts’ consensus revisions, accounting practices, and various return ratios. It has tested to be highly predictive for identifying the best (most undervalued) and worst (most overvalued) sectors, with a 1-3 month forward look.
Bull Score and Bear Score are based on the price behavior of the underlying stocks on particularly strong and weak days during the prior 40 market days. They reflect investor sentiment toward the stocks (on a relative basis) as either aggressive plays or safe havens. So, a high Bull score indicates that stocks within the ETF have tended recently toward relative outperformance during particularly strong market periods, while a high Bear score indicates that stocks within the ETF have tended to hold up relatively well during particularly weak market periods.
Thus, ETFs with high Bull scores generally perform better when the market is hot, ETFs with high Bear scores generally perform better when the market is weak, and ETFs with high Outlook scores generally perform well over time in various market conditions.
Of course, each ETF has a unique set of constituent stocks, so the sectors represented will score differently depending upon which set of ETFs is used. For Sector Detector, I use ten iShares ETFs representing the major U.S. business sectors.
About Trading Strategies: There are various ways to trade these rankings. First, you might run a sector rotation strategy in which you buy long the top 2-4 ETFs from SectorCast-ETF, rebalancing either on a fixed schedule (e.g., monthly or quarterly) or when the rankings change significantly. Another alternative is to enhance a position in the SPDR Trust exchange-traded fund (SPY) depending upon your market bias. If you are bullish on the broad market, you can go long the SPY and enhance it with additional long positions in the top-ranked sector ETFs. Conversely, if you are bearish and short (or buy puts on) the SPY, you could also consider shorting the two lowest-ranked sector ETFs to enhance your short bias.
However, if you prefer not to bet on market direction, you could try a market-neutral, long/short trade—that is, go long (or buy call options on) the top-ranked ETFs and short (or buy put options on) the lowest-ranked ETFs. And here’s a more aggressive strategy to consider: You might trade some of the highest and lowest ranked stocks from within those top and bottom-ranked ETFs.