Gradient Insights: Determining if SaaS migration to subscription model disguises fundamental headwinds
 by Bradley Cipriano, CPA
Equity Analyst, Gradient Analytics LLC (a Sabrient Systems company)
The software industry is rapidly adopting a Software-as-a-Service (SaaS) subscription model, which tends to drive higher lifetime customer values, and lower volatility in revenue and earnings growth compared to the traditional software licensing model. SaaS companies, which provide their software on a subscription basis via the cloud, have grown at a rapid pace in recent years. Moreover, they are poised to continue their strong growth trajectory as more enterprises adopt cloud-based services. And yet according to Synergy Research Group, SaaS revenue accounted for only about 23% of the total software market in 2019 despite growing 39% YOY and eclipsing $100 billion in annual sales, as shown below in Chart 1.
Chart 1. Enterprise SaaS Market Growth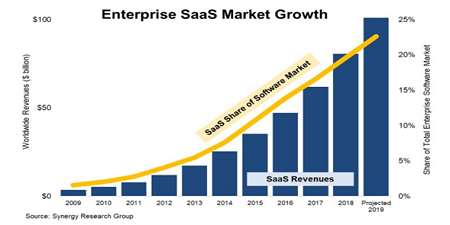
The relatively low penetration rate of SaaS models implies that there is plenty of runway left for increased adoption. Unfortunately, when companies migrate toward a subscription billing model, financial transparency diminishes as the financial statements are impacted by the change. For example, sales growth tends to decelerate and cashflows tend to decline. These trends can be misconstrued as a sign of a financial distress when instead the company is rapidly growing while transitioning its billing model. However, sometimes the distress is real.
Given the benefits and the relatively low penetration rate of SaaS models, we believe that software providers will increasingly migrate towards a subscription model going forward. Therefore, we likely will continue to observe software companies reporting decelerating growth and deteriorating cashflows during the migration. However, we also must be on the lookout for companies that are under fundamental pressure and are using the SaaS migration explanation to disguise growth and cashflow headwinds.
In this article, I attempt to discern between these two possibilities. First, I describe how transitioning from a licensing sales model to a subscription billing model can impact a software company’s financial statements. Then, I examine two different companies that have undergone a SaaS billing model transition – Adobe Inc. (ADBE) and MicroStrategy Inc. (MSTR) – and point out key differences between them that can help investors differentiate between an apparent slowdown in sales caused by a successful SaaS transition and an actual slowdown caused by fundamental headwinds. In my view, ADBE is an example of a successful SaaS transition, while MSTR is an example of a company that was struggling to grow sales all along but temporarily disguised these issues as a “normal” transition. I conclude by applying the same analysis to Splunk (SPLK), which is in the midst of its own transition to a SaaS billing model. Read on...
How a subscription sales model transition impacts the income statement
In general, there are two different types of software contracts: license contracts and subscription contracts. From an accounting standpoint, the primary difference between the two is that license revenue is recognized entirely upfront upon transfer of the license, while subscription sales are recognized ratably over the contract term. This is an important difference, as license sales result in higher rates of sales and earnings growth in the near term relative to subscription sales, while subscription sales lead to smoother rates of growth.
This dynamic can be illustrated with a hypothetical company having a $1.0 million topline run rate. If the company records a $100,000 software booking as a license agreement, it will report a 10.0% YOY increase in sales in Year 1 since 100% of the bookings are recognized upfront. However, without a similar $100,000 booking in Year 2, annual sales will decline by 9.1% YOY in the following year. On the other hand, had the $100,000 software bookings been recorded as a three-year subscription agreement, the firm’s topline growth rate would have been more linear and less volatile. As shown below in Table 1, the $100,000 subscription booking resulted in a relatively modest 3.3% YOY increase in sales during Year 1, but the volatility was removed as sales were flat in Year 2 and Year 3.
Table 1. Illustration of Differing Topline Growth Rates from License and Subscription Bookings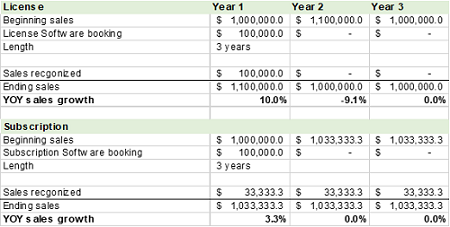
This can be illustrated further using the experience of Adobe (ADBE), which began its SaaS transition around 2008 when SaaS was less than 1.0% of the firm’s total sales. ADBE’s proportion of SaaS rapidly increased, and by 2013 SaaS accounted for 28.1% of total sales; however, sales growth also decelerated during this period. As shown below in Chart 2, sales growth decelerated as ADBE’s SaaS mix grew, and sales even declined YOY in 2013.
Chart 2. Adobe’s YOY Growth in Annual Sales and Mix of Subscription Sales 2011-2013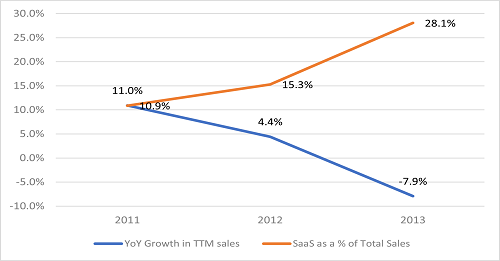
In such a case, outsiders are often left wondering if the topline deceleration is fully attributable to a rise in subscription mix, or if organic growth is also slowing. We can illustrate this concern by examining the SaaS transition of MicroStrategy (MSTR), which portrayed similar topline trends as ADBE during its subscription transformation. For instance, MSTR’s mix of subscription sales grew from less than 1.0% in 2012 to 6.0% of total sales by 2016. While the growth was subdued relative to ADBE, the trend was similar, as illustrated below in Chart 3. MSTR’s sales growth decelerated while the proportion of SaaS sales increased between 2014 and 2016. Specifically, MSTR’s annual sales growth rate decelerated from +0.7% YOY growth in 2014 to -3.1% YOY decline in 2016 while its proportion of SaaS sales increased from 3.8% of total sales in 2014 to 6.0% of total sales in 2016. It begs the question, was the deceleration in sales driven by MSTR’s growing SaaS mix, or was the decline in sales driven by other factors?
Chart 3. MicroStrategy’s YOY Growth in Annual Sales and Mix of Subscription Sales 2012-2016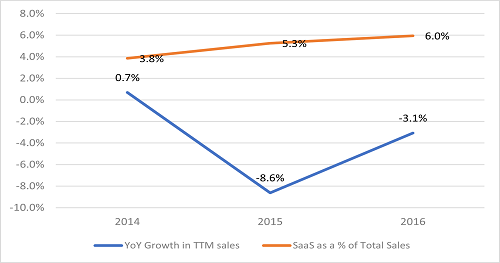
Cashflows and accruals help determine health of SaaS transition
Since sales tend to slowdown during a SaaS transition, how can we determine if the topline slowdown was entirely caused by the change in billing terms, or if the slowdown represents something more concerning? While every company’s SaaS transition is different, analyzing the quality of recently reported revenue can provide valuable insights.
We can determine the quality of revenue by understanding the relationship between cash sales and accrued sales. On a high level, cash-supported sales are higher quality relative to accrued sales. This is simply because it is more valuable to have cash in hand versus cash owed to you. Moreover, growth in deferred revenue generally signals that sales are supported with cash, while growth in accounts receivables means that sales were driven by accruals rather than cash. We can use deferred revenue and accounts receivable accruals to determine the quality of recently reported sales growth.
Ostensibly, a rising deferred revenue balance signals rising cash support for sales, which improves the quality of recently reported sales growth. Furthermore, as the name implies, deferred revenue ultimately gets recognized as revenue, meaning that a rising deferred revenue balance implies rising sales in the future. Following this logic, if sales are slowing but deferred revenue is growing, we can conclude that the slowdown in sales is likely only temporary since there is ample balance sheet support for future sales.
Conversely, if revenue is recognized before cash is received, then this leads to the accrual of accounts receivables. A rise in accounts receivables signals that sales are increasingly being accrued, which lowers the quality of recently reported sales growth. Generally, growing accounts receivable accruals means that recently reported revenue does not yet have cash support, which is lower quality relative to cash-supported sales (e.g. growing deferred revenue). Gradient believes that decelerating sales growth coupled with rising accounts receivable accruals signals that there may be a fundamental slowdown in sales growth that cannot be explained simply by a rise in subscription sales.
We again can utilize ADBE’s and MSTR’s SaaS migrations to further illustrate how cashflows and accruals can be used to gauge the health of recently reported revenue growth. Recall from above that both firms’ sales growth had decelerated as they migrated to a subscription billing model. However, each had markedly different accrual profiles, as ADBE exhibited growing deferred revenue while MSTR exhibited growing accounts receivables.
As pictured below in Chart 4, ADBE’s deferred revenue balance increased 62.8% to $775.5 million between 2011 to 2013, while ADBE’s accounts receivables declined -5.5% during the same period to $599.8 million (deferred revenue is shown as a negative balance because it is a liability). Moreover, ADBE switched from a net accounts receivable balance to a net deferred revenue balance between 2011 and 2013, meaning that cash received upfront was larger than cash owed to the firm. This dynamic improves ADBE’s revenue quality and provides further confidence that ADBE’s topline deceleration in sales (shown above in Chart 2) was likely driven purely by a rise in subscription sales.
Chart 4. Adobe’s Accounts Receivable and Deferred Revenue Balances 2011-2013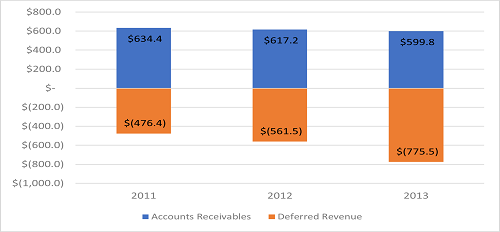
On the other hand, MSTR showed a sharp rise in accounts receivables relative to deferred revenue when its sales growth was slowing. As mentioned above, MSTR’s sales growth had materially decelerated between 2014 and 2016 as its SaaS mix grew from 3.8% of total sales in 2014 to 6.0% of total sales in 2016. At the same time, the firm’s net deferred revenue balance (which is the difference between deferred revenue and accounts receivables) declined YOY in 2016. As shown below in Chart 5, MSTR’s net deferred revenue balance declined 13.0% YOY in 2016 to $36.1 million. The decline in net deferred revenue implies that accounts receivables grew faster than deferred revenue. This is a concerning trend in our view and suggests that the deacceleration in sales in 2016 was not entirely due to the firm’s rising proportion of subscription sales.
Chart 5. MicroStrategy’s Net Deferred Revenue Balance 2014-2016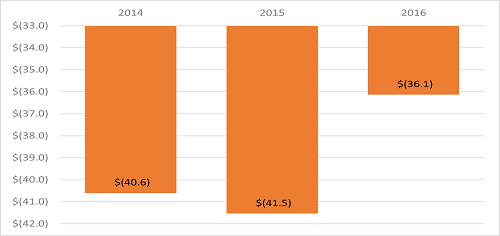
With the benefit of hindsight, we can see that ADBE’s SaaS transition was successful while MSTR’s SaaS transition never fully materialized. For example, ADBE’s sales decline in 2013 quickly reversed in 2014 and sales have increased YOY every year since. ADBE’s deceleration in sales in 2013 also was offset by a rapidly rising deferred revenue balance, which helped support future sales. However, MSTR’s net deferred revenue balance declined while its sales decelerated, which in retrospect appears to have forewarned that the sales decline was not entirely driven by a rise in subscription sales. Note that in 2017, MSTR’s stock declined 25% after its Q2 2017 earnings release, as topline growth never materialized. MSTR’s CEO explained during the company’s Q2 2017 Conference Call that “we haven't been growing…in the past 12 months.” It appears that MSTR’s declining revenue quality portended the decline in growth.
Case study: Splunk Inc.
We can leverage our understanding of the previous examples to assess Splunk Inc. (SPLK) and its current transition to a subscription billing model. SPLK is a large software company that has been migrating away from perpetual license sales towards subscription software contracts. The billing model transition has accelerated recently, leading to a decline in sales and cashflows. As shown below in Chart 6a, cashflows from operations (CFOA) have gone from an inflow of $308.4 million in Q2 FY2019 down to an outflow of $317.8 million in Q2 FY2021. At the same time, quarterly sales growth has materially decelerated to a -4.8% YOY decline in the latest quarter, as shown in Chart 6b.
Chart 6a. Splunk’s TTM Cashflow from Operations – Q2 FY2019 to Q2 FY2021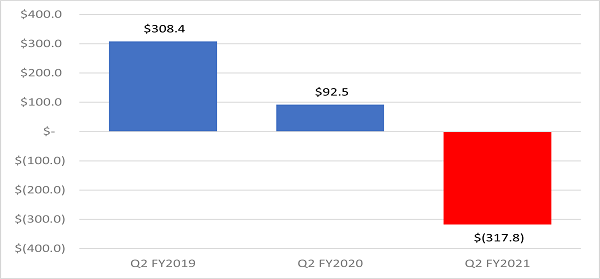
Chart 6b. Three-year Trend of Splunk’s Quarterly Sales Growth 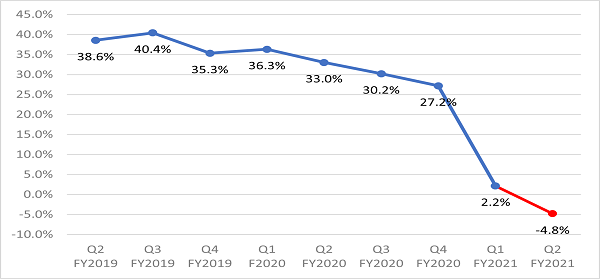
Typically, declining sales and cashflows are a sign that a company is in distress. However, SPLK has recently ramped its transition to a subscription billing model, which may explain the topline pressure and cashflow deterioration in recent quarters. As shown below in Chart 7, the proportion of subscription sales (combining cloud, maintenance, and service sales) has increased to 64.0% of quarterly sales, up from 45.9% in the prior year period. SPLK also disclosed that it lowered its invoice yield YOY, from about 58% of the contract value collected upfront as cash down to about 33% collected upfront in cash. Given the increased subscription mix, we would expect to see deferred revenue growth accelerate, albeit at a more moderate rate relative to the prior year as a result of the lower invoice yield.
Chart 7. YOY Change in Splunk’s Mix of Subscription and License Sales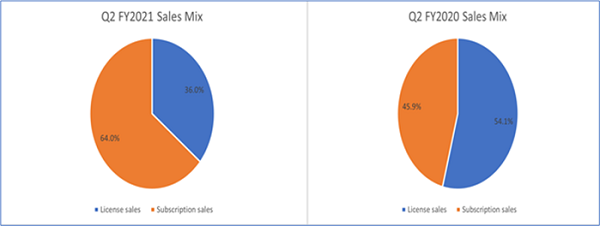
Similarly, we would expect that lower rates of license bookings would lead to a deceleration in accounts receivable accruals. This is because license sales drive outsized accounts receivable accruals relative to subscription sales, since 100% of license sales are recognized upfront, but SPLK only collects around 33% of the contract value upfront in cash. With a lower mix of license sales, accounts receivable accruals should moderate relative to the prior year.
To provide greater context, we note that in the last twelve months, SPLK’s license sales have increased $43.6 million on a YOY basis. Since 33% of the contract value is typically received upfront as cash (i.e., its “invoice yield”), 67% is booked as accounts receivable. So, we would have expected that the $43.6 million YOY growth in license sales would have led to a $29.2 million YOY rise in accounts receivable. Assuming a conservative 0% invoice yield implies that the $43.6 million YOY growth in term sales would have led to $43.6 million YOY growth in accounts receivable accruals. However, SPLK’s total accounts receivable actually increased by an astonishing $463.5 million YOY. The sharp rise in accounts receivables cannot be explained by a billing model transformation, in our view, and requires further investigation. Ostensibly, the sharp rise in accounts receivable accruals could signal that recently reported revenue is unsustainable.
Trends in deferred revenue accruals
Recall that ADBE’s deceleration in sales was accompanied by an acceleration in deferred revenue growth. Similarly, we would have expected SPLK to display accelerated deferred revenue growth, given the increased mix of subscription sales in recent periods. This is because SPLK receives 33% of the subscription contract value upfront but recognizes subscription revenue over time, which drives deferred revenue accruals. However, despite a rise in subscription sales, SPLK’s net deferred revenue balance flipped to a net accounts receivable balance over the last twelve months. As shown below in Chart 8, SPLK’s net deferred revenue balance of $146.4 million flipped to a net accounts receivable balance of $219.5 million one year later.
Chart 8. YOY Change in Splunk’s Net Accounts Receivable (Net Deferred Revenue) Balance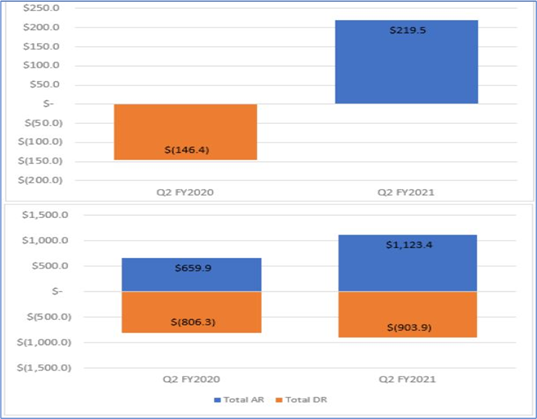
The lower level of deferred revenue also signals that Splunk has relatively less balance sheet support for future sales, implying that sales growth may continue to decelerate going forward. In our view, the deceleration in deferred revenue despite an acceleration in subscription sales growth requires further investigation and calls into question whether SPLK’s decelerating topline growth rate is fully explained by a rise in subscription sales mix.
Limitations in our analysis
It is important to note that our analysis is simply a gauge of the health of the company’s revenue. Timing differences between contract signing and cash receipts can impact deferred revenue and accounts receivable accruals. Moreover, over-generalization of what constitutes subscription sales could skew our analysis, given that we grouped together cloud, maintenance, and service sales as subscription sales. We also do not fully consider the change in invoice yields, which also impacted SPLK’s revenue accruals since payment terms were extended.
However, we still believe that our analysis provides useful insights into SPLK’s billing model transformation. Specifically, we would have expected lower rates of accounts receivable accruals and higher rates of upfront cash collections (deferred revenue) given the increased mix of subscription sales. Our analysis of SPLK’s accruals leads us to believe that the topline growth and cashflow issues discussed above cannot be solely attributable to SPLK’s billing model transition. We dive into SPLK’s accounting and billing model transition in greater detail in our newly issued Alert, which is available to Gradient Analytics’ research subscribers.
Regardless of the eventual outcome of SPLK’s SaaS transformation, the high-level examples presented above can be used as reference points when examining other companies that are transitioning to a subscription billing model, a trend that surely will continue to rise going forward.
Disclosure: At the time of this writing, the author held no positions in the securities mentioned.
Disclaimer: This newsletter is published solely for informational purposes and is not to be construed as advice or a recommendation to specific individuals. Individuals should take into account their personal financial circumstances in acting on any opinions, commentary, rankings, or stock selections provided by Sabrient Systems or its wholly owned subsidiary Gradient Analytics. Sabrient Systems makes no representations that the techniques used in its rankings or analysis will result in or guarantee profits in trading. Trading involves risk, including possible loss of principal and other losses, and past performance is no indication of future results.