Earnings Quality Rank (version 2) leads new lineup of alpha factors

By Brent Miller, CFA
President & Director of Research, Gradient Analytics (a Sabrient Systems company)
The value of quantitative, rules-based, process-driven equity models is clear. They can be tested based on various historical timeframes and market conditions, sectors, market caps, and regions, while removing emotion from investment decisions. And with the exception of brief market periods driven by speculative fervor, investors tend to favor high-quality companies with solid fundamentals.
Sabrient Systems specializes in building fundamentals-based equity models that seek to generate alpha versus a market benchmark, including alpha factors and strategic beta indexes. In 2011, Sabrient acquired Gradient Analytics, a fundamental equity research firm with a team of forensic accounting specialists who focus on assessing earnings quality and anomalous insider activity, in part to enhance Sabrient’s quantitative model-building capabilities. Together, we leverage a unique collaboration of engineers and forensic accountants and a scientific hypothesis-testing approach to create proprietary alpha factors, multifactor models, process-driven portfolio strategies, and rules-based indexes.
In 2013, the combined team created the original version of our Earnings Quality Rank (EQRv1), a pure accounting-based risk assessment factor based on the collective experience and expertise of Gradient’s analyst team in identifying company-level earnings quality issues, aggressive accounting tactics, and misleading “financial engineering.” More recently, we enhanced the model to create EQRv2.
Furthermore, the Sabrient/Gradient team has created a variety of other valuable alpha factors, including an enhanced version of Sabrient’s flagship Growth at a Reasonable Price (GARP) model and several other factors related to value, growth, quality, and momentum. All told, we now publish the following eight “Sabrient Scores”:
- Growth at a Reasonable Price (GARPv2)
- Earnings Quality Rank version 2.0 (EQRv2)
- Growth Quality Rank (GQRv2)
- Strategic Valuation Rank (SVR)
- Strategic Growth Rank (SGR)
- Aggregate Price Momentum Rank (AMR)
- Bull Score (BULL)
- Bear Score (BEAR)
For institutional quants and systematic traders, we offer five of these alpha factors (EQR, GQR, SVR, SGR, AMR) as a factor suite (“Equity Factor Rankings”) for licensing through Nasdaq Data Link. However, fundamental analysts, financial advisors, and individual investors also find them valuable for screening, idea generation, risk monitoring, and confirmation. On a temporary basis, you can access all 8 of these Sabrient Scores free of charge through our SmartSheets products (one that provides scores for over 4,200 stocks and one for over 1,200 equity ETFs). Ultimately, they will be behind a paywall as a companion product to our powerful and comprehensive SmartLightsTM web application.
In this article, I provide further details on the purpose and basis for our Earnings Quality Rank and other alpha factors, including a summary of back-tested performance. Read on....
Earnings Quality Rank:
The original version (EQRv1) was developed jointly by Sabrient and Gradient in 2013 as a pure accounting-based risk assessment signal reflecting key relationships among information contained in the income statement, balance sheet, and cash flow statement, primarily working capital and cash flow factors. It employs a relative-scoring engine to compare each company against its peers in similar industries with comparable accounting systems and then rolls up industry-level rankings into a universe-wide aggregate rank. EQRv1 employs 2 sub-models: 1) a general non-banking model applied to most industries and 2) a separate banking model tailored specifically to the unique aspects of this industry. Also, EQRv1 looks at financial ratios at a single snapshot in time, based on a given company’s most recent quarterly earnings report. So, there is often a timing mismatch in comparing companies’ financial ratios.
In 2019, we created the second generation of the Earnings Quality Rank, EQRv2. While EQRv1 continued to deliver robust live performance, we believed the model could be improved with the introduction of more granular sub-models comprising individual factors that were specifically tailored to the unique business models and accounting systems of specific sectors, industry groups, and industries that constitute the model’s scored universe.
As a result, EQRv2 leverages 30 unique industry-specific sub-models. In addition, EQRv2 employs trend analysis in the selected financial ratios to better assess the direction of a company’s improvement or deterioration. Lastly, we developed a custom factor-weighting scheme to further enhance model performance, as opposed to EQRv1’s more simplistic equal-weight approach. The resulting improvement in performance, particularly the Top–Bottom performance spread is illustrated below:
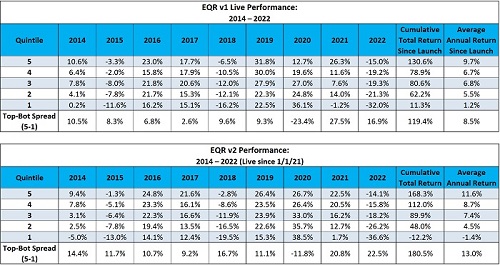
You can tell by the solidly positive Top–Bottom spreads that investors tend to favor stocks with strong fundamentals and high earnings quality most of the time, except for those rare periods that are driven by risk-on speculation (thus inverting the spread)—like 2020 when money supply surged, markets rallied hard off the pandemic selloff low, and individuals were flush with cash (and paid to stay home) to speculate on aggressive growth companies, meme stocks, SPACs, cryptocurrencies, and NFTs. Other years that displayed flat or inverted Top–Bottom spreads were 2003 and 2009, which were characterized by strong speculative rallies following the dot-com bust and the Great Financial Crisis.
Additional Alpha Factors:
Sabrient has long been known for its Growth at a Reasonable Price (GARP) approach to stock selection, and in fact it serves as the foundation of the prescreen for our Baker’s Dozen portfolios. The latest version (GARPv2) combines fundamental growth, value, and quality factors, such as historical and projected earnings-per-share (EPS) growth, forward price/earnings ratio (P/E), dynamics of recent revisions to EPS estimates from the sell-side analyst community, quality of earnings (as described above for EQR), and quality for growth (as described below for GQR). Notably, by adding GQRv2 to our GARP model, it allows for some higher-P/E secular growth companies to be competitive in the rankings with the lower-P/E cyclical growth companies that the original version of our GARP model tended to favor, thus improving all-weather performance and reducing volatility relative to market benchmarks (which tend to be dominated by the growth factor).
The Growth Quality Rank (GQRv2) compares the consistency and reliability of a company’s earnings growth, history of earnings surprises, and its historical likelihood of meeting consensus earnings estimates versus industry peers. Regarding consistency, it looks at magnitude and volatility of quarter-over-quarter non-GAAP EPS growth over a combined historical and forward timeframe. Regarding reliability, it compares the point-in-time non-GAAP quarterly EPS growth estimates to what the company actually reported over the past few years on both a quarter-over-quarter and year-over-year basis. GQR provides granularity to earnings growth trends, and testing has shown that it helps to forecast the likelihood that a company will meet or exceed its consensus EPS estimates over the next 12-18 months.
The Strategic Valuation Rank (SVR) utilizes trailing and forward valuation ratios related to income statement, balance sheet, and statement of cash flows. It employs a relative-scoring engine to compare each company against its peers in similar industries, and then rolls up those industry-level rankings into a universe-wide aggregate rank. The Strategic Growth Rank (SGR) utilizes a combination of factors related to historical cash flow, revenue, operating income, and EPS growth in addition to expected growth (as derived from sell-side analyst consensus estimates). It, too, employs a relative-scoring engine to compare each company against its peers in similar industries, and then rolls up those industry-level rankings into a universe-wide aggregate rank.
Aggregate Price Momentum Rank (AMR) measures price trends in a wide array of time periods to develop a holistic assessment of price momentum. It, too, employs a relative-scoring engine to compare each company against its peers in similar industries, and then rolls up those rankings into a universe-wide aggregate rank.
Bull Score (BULL) indicates a stock's relative tendency to outperform during strong market conditions. The higher the score, the more likely the stock has tended to outperform the benchmark in a rising market. On the flipside, our BEAR Score (BEAR) indicates a stock’s relative tendency to outperform during weak market conditions. The higher the score, the more likely the stock has tended to outperform the benchmark in a falling market.
The table below summarizes a 20-year (2003–2022) factor backtest of the 8 Sabrient Scores discussed. Note that in evaluating BULL and BEAR scores, we used +15% as the dividing line between a “strong” market and a “weak” (or lackluster) market. During the 20-year period, there were 10 years in which the S&P 500 returned more than the +15% threshold and 10 years in which it returned less.
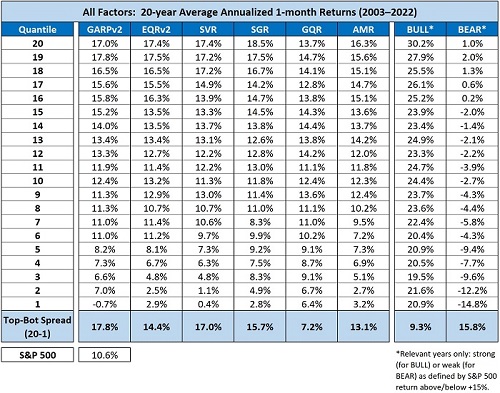
Again, the “Equity Factor Rankings” 5-factor suite is available for licensing as a weekly data feed through Nasdaq Data Link. For fundamental analysts, financial advisors, and individual investors, all 8 of the scores shown in the table above can be found in our SmartSheets products, which provide weekly scores for over 4,200 stocks and 1,200 equity ETFs.
Disclaimer: This newsletter is published solely for informational purposes and is not to be construed as advice or a recommendation to specific individuals. Individuals should take into account their personal financial circumstances in acting on any opinions, commentary, rankings, or stock selections provided by Sabrient Systems or its wholly owned subsidiary Gradient Analytics. The information contained herein is based on sources believed to be reliable, but no warranty or representation of any kind, expressed or implied, is made as to its accuracy, completeness, or correctness. Sabrient Systems makes no representations that the techniques used in its rankings or analysis will result in or guarantee profits in trading. Trading involves risk, including possible loss of principal and other losses, and past performance is no indication of future results.