Sector Detector: Stocks complete summer recovery from "Sell-in-May" crowd
 We’re coming down to the final sleepy weeks of a relatively uneventful summer in the equity markets. Volume is quite low, as is expected this time of year with investment managers in vacation mode. Nevertheless, the S&P 500 has now recovered all of its losses since the “Sell-in-May” crowd hit the market hard, sending the S&P 500 falling 9% from a close of 1406 on May 1 to 1278 on June 1. Since then, stocks have steadily climbed in the face of frightening global headlines within a clearly-defined bullish rising channel.
On Wednesday, the S&P 500 closed at 1405.53 to challenge technical resistance at that May 1 high. Bulls have been valiantly shoring up intraday weakness each day to ensure markets hold their psychologically important support levels of Dow 13,000, Nasdaq 3,000, S&P 500 1400, and Russell 2000 800.
Curiously, the selection of Congressman Paul Ryan as Mitt Romney’s running mate has served to re-energize both parties, which I think has been bullish for the markets. Republicans feel that he enhances Mitt Romney’s conservative stripes while adding a poised, rational, intelligent, and engaging personality to the ticket, while Democrats believe that his budget proposals have been so radical that it will make re-election easier for the incumbents. So, everyone has been given a dose of optimism.
Overall, corporate revenues have been struggling to grow year-over-year, while earnings growth has been more robust as costs have been cut to the bone and productivity continues to improve. In this slow-growth world, it is particularly important for investors to take a hard look at the aggressiveness of a company’s accounting practices.
On this topic, I have pointed out periodically that Sabrient subsidiary Gradient Analytics, which produces in-depth forensic accounting research, has been particularly successful at rooting out firms with questionable earnings quality and revenue-recognition practices by examining trends in things like accruals, receivables, payables, inventories, cash flow, margins, allowance for doubtful accounts, pension liabilities, effective tax rates, etc., as well as anomalous insider trading behavior (particularly with their equity incentives and SEC Rule 10b5-1 plans).
This is more important than ever these days. Indeed, many of Gradient’s negatively-rated stocks have fallen recently after their earnings reports, including Ritchie Bros (RBA), comScore (SCOR), FARO Technologies (FARO), and Innophos Holdings (IPHS). Moreover, a growing number of Chinese companies are pulling their listings off of the U.S. exchanges, often because of accusations of improper accounting or because of U.S. insistence on examining their China-based auditors.
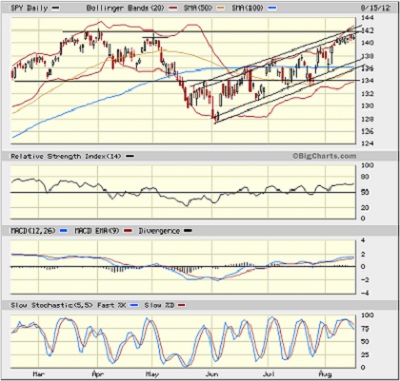
Looking at the SPY chart, it closed Wednesday at 140.95 and has been trading since mid-May within a bullish rising channel. (Note that I am showing two different sets of possible boundaries for the channel.) There is really no change in the chart from last week. SPY is still dealing with technical resistance from the convergence of the top of the rising channel and the April-May closing highs. The 50-day simple moving average has turned up and is crossing up through the 100-day SMA in a bullish manner. Price sits comfortably above the 20-, 50-, 100-, and 200-day SMAs. As I suggested the last two weeks, if SPY can’t break out through the top of the rising channel, it might cycle back down towards the bottom of the channel for a sixth time.

Some technicians are calling this a triple top sell signal, but I’m not at all convinced. It just needs more volume. We’ll see if it can hold up long enough for the reinforcements to come back from vacation. Perhaps in the meantime it will continue to work off some of those overbought indicators.
The VIX (CBOE Market Volatility Index—a.k.a. “fear gauge”) continues to fall, closing Wednesday at 14.63 after coming within a whisker of taking out the 52-week lows from March at 13.66. I suggested last week that it appeared ready to make a push down through 15 to challenge the lows. No signs of the investor anxiety you would expect, given the global economic situation.
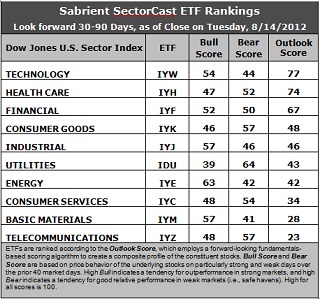
Latest rankings: The table ranks each of the ten U.S. industrial sector iShares (ETFs) by Sabrient’s proprietary Outlook Score, which employs a forward-looking, fundamentals-based, quantitative algorithm to create a bottom-up composite profile of the constituent stocks within the ETF. In addition, the table also shows Sabrient’s proprietary Bull Score and Bear Score for each ETF.
High Bull score indicates that stocks within the ETF have tended recently toward relative outperformance during particularly strong market periods, while a high Bear score indicates that stocks within the ETF have tended to hold up relatively well during particularly weak market periods. Bull and Bear are backward-looking indicators of recent sentiment trend.
As a group, these three scores can be quite helpful for positioning a portfolio for a given set of anticipated market conditions.

Observations:
1. Technology (IYW) regains the second spot with an Outlook score of 77. Stocks within IYW are displaying relatively low forward P/Es, strong projected long-term growth, and solid return ratios. Healthcare (IYH) moves up to second place with a 74, while Financial (IYF) falls to third this week with an Outlook score of 67. The mild shuffling is primarily due to shifting support among analysts, who have been revising earnings estimates up and down during earnings season.
2. There is a 19-point gap down to fourth place Consumer Goods (IYK) at 48. Only IYW, IYH, and IYF are scoring above the 50 mid-point level, and the range from top to bottom is only 54, which is relatively narrow. Also, defensive sectors like IYK and Utilities (IDU) are scoring in the middle of the pack. I think all of this reflects a cautious tone among analysts, particularly given recent market strength and the slow-growth economy. You no doubt have been reading about lowered earnings projections, and it is reflected here, as well, as most of the sectors are seeing net downgrades. Overall, I would say these rankings are neutral (rather than bullish or bearish).
3. Telecom (IYZ) stays at the bottom of the Outlook rankings this week with an Outlook score of 23. It retains surprisingly good support from Wall Street, but stocks within IYZ are held back by the highest forward P/E and the worst return ratios. Basic Materials (IYM) is in the bottom two with a score of 28 as it continues to be hampered by cuts in Wall Street’s earnings estimates, but still reflects the lowest forward P/E.
4. Looking at the Bull scores, Energy (IYE) is the clear leader on strong market days, scoring 63. Utilities (IDU) is still by far the weakest on strong days, scoring 39. In other words, Energy stocks have tended to perform the best when the market is rallying, while Utilities stocks have lagged.
5. Looking at the Bear scores, Utilities (IDU) remains the strong investor favorite “safe haven” on weak market days, scoring 64. Materials (IYM) has been abandoned (relatively speaking) by investors during market weakness, as reflected by its low Bear score of 41, followed by Energy (IYE) at 42. In other words, Materials stocks have tended to sell off the most when the market is pulling back, while Utilities stocks have held up the best.
6. Overall, Technology (IYW) now shows the best all-weather combination of Outlook/Bull/Bear scores. Adding up the three scores gives a total of 175. Materials (IYM) is the worst at 126. As for Bull/Bear combination, Materials (IYM) and Tech (IYW) share the worst at 98, while Telecom (IYZ) and Energy (IYE) tie for the best with 105.
These scores represent the view that the Technology and Healthcare sectors may be relatively undervalued overall, while Telecom and Materials sectors may be relatively overvalued based on our 1-3 month forward look.
Top-ranked stocks within Technology and Healthcare sectors include Western Digital (WDC), Symantec (SYMC), United Therapeutics (UTHR), and PDL BioPharma (PDLI).
Disclosure: Author has no positions in stocks or ETFs mentioned.
About SectorCast: Rankings are based on Sabrient’s SectorCast model, which builds a composite profile of each equity ETF based on bottom-up scoring of the constituent stocks. The Outlook Score employs a fundamentals-based multi-factor approach considering forward valuation, earnings growth prospects, Wall Street analysts’ consensus revisions, accounting practices, and various return ratios. It has tested to be highly predictive for identifying the best (most undervalued) and worst (most overvalued) sectors, with a one-month forward look.
Bull Score and Bear Score are based on the price behavior of the underlying stocks on particularly strong and weak days during the prior 40 market days. They reflect investor sentiment toward the stocks (on a relative basis) as either aggressive plays or safe havens. So, a high Bull score indicates that stocks within the ETF have tended recently toward relative outperformance during particularly strong market periods, while a high Bear score indicates that stocks within the ETF have tended to hold up relatively well during particularly weak market periods.
Thus, ETFs with high Bull scores generally perform better when the market is hot, ETFs with high Bear scores generally perform better when the market is weak, and ETFs with high Outlook scores generally perform well over time in various market conditions.
Of course, each ETF has a unique set of constituent stocks, so the sectors represented will score differently depending upon which set of ETFs is used. For Sector Detector, I use ten iShares ETFs representing the major U.S. business sectors.
About Trading Strategies: There are various ways to trade these rankings. First, you might run a sector rotation strategy in which you buy long the top 2-4 ETFs from SectorCast-ETF, rebalancing either on a fixed schedule (e.g., monthly or quarterly) or when the rankings change significantly. Another alternative is to enhance a position in the SPDR Trust exchange-traded fund (SPY) depending upon your market bias. If you are bullish on the broad market, you can go long the SPY and enhance it with additional long positions in the top-ranked sector ETFs. Conversely, if you are bearish and short (or buy puts on) the SPY, you could also consider shorting the two lowest-ranked sector ETFs to enhance your short bias.
However, if you prefer not to bet on market direction, you could try a market-neutral, long/short trade—that is, go long (or buy call options on) the top-ranked ETFs and short (or buy put options on) the lowest-ranked ETFs. And here’s a more aggressive strategy to consider: You might trade some of the highest and lowest ranked stocks from within those top and bottom-ranked ETFs, such as the ones I identify above.
