Sector Detector: Still bullish as stocks await their “go” signal from Congress
 Stock market bulls have been reluctant to let the market fall very far. Support seems to arrive whenever the bears get too bold. It seems the bulls are bound and determined to have their Q4 rally, especially with the Fed continuing to blow wind in their sails. They just need Congress to wave the green flag.
Given strong support from the Fed, improving US economic indicators and corporate earnings, bullish Sabrient SectorCast rankings, and favorable charts, all systems seem ready for liftoff. Moreover, many of the big players and large hedge funds are still underweight equities. On Wednesday, the market gave further indication of its desire to move higher, as it started the day weak, fell further on a weak ADP employment report, and then slowly worked its way higher before getting a final little pop in the last few minutes to nearly make it back to even.
Consensus opinion is that the impact on the economy of this federal government shutdown will be trivial if it only lasts a few days, but potentially devastating if it becomes protracted. This is the main reason that the FOMC chose not to start tapering. The last time the government shut down was in 1996, featuring President Clinton and Speaker Gingrich. It shaved an estimated half percentage point off GDP.
However, that was during the glory years of unprecedented world peace, the dawn of the Internet age, and a generally healthy economy that didn’t rely upon quant easing. This time around, it is unlikely that our principled politicians will cave so quickly. How it all falls out is going to be interesting.
Notably, the NASDAQ Internet Index (QNET) has been incredibly strong this year. On Wednesday, while the market was generally soft, big moves of 3-5% were seen in names like Pandora Media (P), YY Inc (YY), Trulia (TRLA), WebMD (WBMD), and Zillow (Z).
The SPDR S&P 500 Trust (SPY) closed Wednesday at 169.18, which is right back to where it was last Wednesday. Nevertheless, it has been clinging to support at the 50-day simple moving average. The original uptrend line from the late-June bounce failed again as support, but another uptrend line (shown) seems to be doing a better job. SPY also closed the price gap up from September 10 around 167.50, which provided further support, and oscillators like RSI, MACD, and Slow Stochastic have all worked off their overbought conditions and look mostly neutral now. Next levels of support include the 100-day SMA near 166, followed by 165, 160, and then the 200-day SMA around 158. Resistance will arise first at 170, but I doubt there will be much hesitation at that level if bulls decide it’s time to rally.
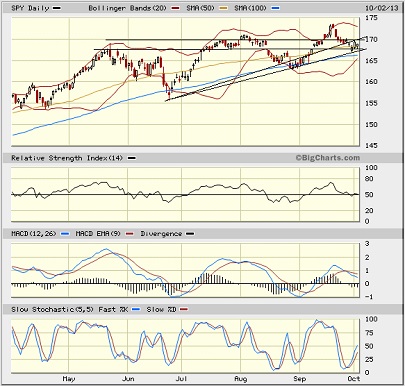
The CBOE Market Volatility Index (VIX), a.k.a. “fear gauge,” closed Wednesday at 16.56. It has been climbing since hitting recent lows near 13 on September 20. This indicates some elevated investor anxiety, although it remains below the important 20 level.
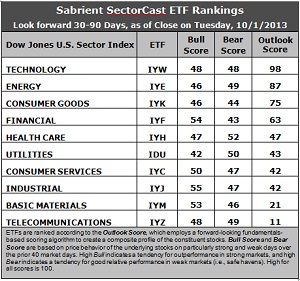
Latest rankings: The table ranks each of the ten U.S. business sector iShares ETFs by Sabrient's proprietary Outlook Score, which employs a forward-looking, fundamentals-based, quantitative algorithm to create a bottom-up composite profile of the constituent stocks within the ETF. The multi-factor model considers forward valuation, historical earnings trends, earnings growth prospects, the dynamics of Wall Street analysts' consensus estimates, accounting practices and earnings quality, and various return ratios. In addition, the table also shows Sabrient's proprietary Bull Score and Bear Score for each ETF.
High Bull score indicates that stocks within the ETF have tended recently toward relative outperformance during particularly strong market periods, while a high Bear score indicates that stocks within the ETF have tended to hold up relatively well during particularly weak market periods. Bull and Bear are backward-looking indicators of recent sentiment trend.
As a group, these three scores can be quite helpful for positioning a portfolio for a given set of anticipated market conditions.
Observations:
1. Technology (IYW) remains in the top spot with a near-perfect Outlook score of 98. IYW displays one of the lowest forward P/Es, a solid projected long-term growth rate, the best return ratios, and positive sentiment among both Wall Street analysts (i.e., upgraded earnings estimates) and company insiders (i.e., open-market buying). Energy (IYE) stays in the second spot with an 87. IYE displays the lowest forward P/E and solid return ratios. In third place is Consumer Goods (IYK), which jumped 28 points primarily on the strength of some new analyst earnings upgrades, pushing Financial (IYF) into fourth with a 63. Healthcare (IYH) rounds out the top five.
2. Telecom (IYZ) is in the cellar yet again with an Outlook score of 11. IYZ remains weak in most factors across the board, including a high forward P/E, low return ratios, and modest projected long-term growth. In the bottom two this week is Basic Materials (IYM) with a score of 21.
3. Although there was some shuffling in the scores and placements, this week’s fundamentals-based rankings maintain their bullish bias as Tech, Energy, and Financial all remain in the top four. Industrial (IYJ) dropped from fourth to eighth, but in fact its Outlook score only fell by 2 points in the tightly-packed middle tier of the rankings.
4. Looking at the Bull scores, Industrial (IYJ) remains the leader on particularly strong market days, scoring 55, while Utilities (IDU) is the lowest at 42. The top-bottom spread is 13 points, which continues to indicate somewhat lower sector correlations on particularly strong market days.
5. Looking at the Bear scores, only Healthcare (IYH) and Utilities (IDU) are scoring at or above 50, with IYH the favorite “safe haven” on weak market days, scoring a 52. Financial (IYF) is the lowest at 43. The top-bottom spread is 9 points, which indicates slightly lower (but still relatively high) sector correlations on particularly weak market days. That is, we are still seeing mostly across-the-board selling during extreme market weakness.
6. Overall, IYW shows the best all-weather combination of Outlook/Bull/Bear scores. Adding up the three scores gives a total of 194. IYZ is the by far the worst at 108. Looking at just the Bull/Bear combination, IYJ displays the highest score of 102 this week, which indicates good relative performance in extreme market conditions (whether bullish or bearish), while IYK is the lowest at 90, which indicates notable investor avoidance during extreme conditions.
These Outlook scores represent the view that Technology and Energy sectors are still relatively undervalued, while Telecom and Materials may be relatively overvalued based on our 1-3 month forward look.
Some top-ranked stocks within IYW and IYE that look good to me this week include Cognizant Technology Solutions (CTSH), Western Digital (WDC), Occidental Petroleum (OXY), and Anadarko Petroleum (APC). Each of these companies also rank highly in Sabrient subsidiary Gradient Analytics’ Earnings Quality Rank (EQR), which is a pure accounting-based risk assessment signal that has proven quite valuable for avoiding meltdowns that can ruin overall portfolio performance.
In fact, EQR is a key factor in Sabrient’s Baker’s Dozen annual portfolio. The 2012 portfolio was up +43%, with only two positions slightly negative, and the 2013 portfolio is now up nearly +34% from the portfolio’s inception on January 11, with all 13 stocks comfortably positive, versus the S&P 500 return of +15% over the same timeframe. This year’s leaders include Jazz Pharmaceuticals (JAZZ), Genworth Financial (GNW), and EPL Oil & Gas (EPL).
Furthermore, our new “Earnings Busters” portfolio for Q4 launched on October 1, and I appear on the video along with analyst Walter Gault. Each quarterly portfolio of 20 stocks is based on a similar model to what we use in the annual Baker’s Dozen portfolio. Like Baker’s Dozen, the Earnings Busters Q2 and Q3 portfolios have performed quite well.
Disclosure: Author has no positions in stocks or ETFs mentioned.
About SectorCast: Rankings are based on Sabrient’s SectorCast model, which builds a composite profile of each equity ETF based on bottom-up aggregate scoring of the constituent stocks. The Outlook Score employs a fundamentals-based multi-factor approach considering forward valuation, earnings growth prospects, Wall Street analysts’ consensus revisions, accounting practices, and various return ratios. It has tested to be highly predictive for identifying the best (most undervalued) and worst (most overvalued) sectors, with a 1-3 month forward look.
Bull Score and Bear Score are based on the price behavior of the underlying stocks on particularly strong and weak days during the prior 40 market days. They reflect investor sentiment toward the stocks (on a relative basis) as either aggressive plays or safe havens. So, a high Bull score indicates that stocks within the ETF have tended recently toward relative outperformance during particularly strong market periods, while a high Bear score indicates that stocks within the ETF have tended to hold up relatively well during particularly weak market periods.
Thus, ETFs with high Bull scores generally perform better when the market is hot, ETFs with high Bear scores generally perform better when the market is weak, and ETFs with high Outlook scores generally perform well over time in various market conditions.
Of course, each ETF has a unique set of constituent stocks, so the sectors represented will score differently depending upon which set of ETFs is used. For Sector Detector, I use ten iShares ETFs representing the major U.S. business sectors.
About Trading Strategies: There are various ways to trade these rankings. First, you might run a sector rotation strategy in which you buy long the top 2-4 ETFs from SectorCast-ETF, rebalancing either on a fixed schedule (e.g., monthly or quarterly) or when the rankings change significantly. Another alternative is to enhance a position in the SPDR Trust exchange-traded fund (SPY) depending upon your market bias. If you are bullish on the broad market, you can go long the SPY and enhance it with additional long positions in the top-ranked sector ETFs. Conversely, if you are bearish and short (or buy puts on) the SPY, you could also consider shorting the two lowest-ranked sector ETFs to enhance your short bias.
However, if you prefer not to bet on market direction, you could try a market-neutral, long/short trade—that is, go long (or buy call options on) the top-ranked ETFs and short (or buy put options on) the lowest-ranked ETFs. And here’s a more aggressive strategy to consider: You might trade some of the highest and lowest ranked stocks from within those top and bottom-ranked ETFs.