Scott Martindale  by Scott Martindale
  President & CEO, Sabrient Systems LLC

Stocks are pulling back a bit to start Q2 but have shown remarkable resilience throughout their nearly 6-month (and nearly straight-up) bull run, with the S&P 500 (SPY) finding consistent support at its 20-day simple moving average on several occasions, while the slightly more volatile Nasdaq 100 (QQQ, beta=1.18) has found solid support at the 40-day moving average. Moreover, the Relative Strength Index (RSI) on SPY has reliably bounced off the neutral line (50) on every test. And it all happened again early last week—at least until Thursday afternoon when Minnesota Fed president Neel Kashkari ventured off Fed chairman Jerome Powell’s carefully crafted script to say they may not cut interest rates at all this year if inflation’s decline continues to stall.

Before that moment, Powell had been keeping his governors in line and saying all the right things about imminent rate cuts in the pipeline (albeit making sure not to provide a firm timetable). And the pervasive Goldilocks outlook has lifted stocks to uncomfortably elevated valuations (current forward P/E for SPY of 21.3x and for QQQ of 26.6x) that suggest a need for and expectation of both solid earnings growth in 2024-25 and falling interest rates (as the discount rate on future earnings streams).

Up until Kashkari’s unexpected remarks, it appeared that once again—and in fact every time since last November, when the indexes look extremely overbought and in need of a significant pullback (as typically happens periodically in any given year) a strong bid arrived like the Lone Ranger to save the day and push stocks higher. It has burned bears and kept swing traders who like to “fade” spikes hesitant. Not surprisingly, the CBOE Volatility Index (VIX) has seen only a couple of brief excursions above the 15 line and has been nowhere near the 20 “fear threshold.”

But after his remarks, the market finished Thursday with a huge, high-volume, “bearish engulfing candle,” and the CBOE Volatility Index (VIX) surged 20% intraday (closing at 16.35), and all those previously reliable support levels gave way—until the very next day. On Friday, they quickly recovered those support levels following the apparently strong March jobs report, finishing with a “bullish harami” pattern (that typically leads to some further upside). As you recall from my March post, I have felt a correction is overdue—and the longer it holds off, the more severe the fall. The question now is whether SPY and QQQ are destined for an upside breakout to new highs and a continuation of the bull run…or for a downside breakdown to test lower levels of support. I believe we may get a bit of a bounce here, but more downside is likely before an eventual resumption in the bull run to new highs.

Regardless, the persistent strength in stocks has been impressive, particularly in the face of the Fed's quantitative tightening actions (balance sheet reduction and “higher for longer” rates)—along with the so-called “bond vigilantes” who protest excessive spending by not buying Treasuries and thus further driving up rates—that have created the highest risk-free real (net of inflation) interest rates since the Financial Crisis and reduced its balance sheet by $1.5 trillion from its April 2022 peak to its lowest level since February 2021.

But (surprise!) gold has been performing even better than either SPY or QQQ (as have cryptocurrencies, aka “digital gold”). Gold’s appeal to investors is likely in anticipation of continued buying by central banks around the world as a hedge against things like growing geopolitical turmoil, our government’s increasingly aggressive “weaponization” of the dollar to punish rogue nations, and rising global debt leading to a credit or currency crisis.

To be sure, solid GDP and employment data, a stall in inflation’s decline, rosy earnings growth forecasts for 2024-2025, tight investment-grade and high-yield credit spreads, low volatility in interest rates, a low VIX, and a sudden recovery in manufacturing activity, with the ISM Manufacturing Index having finally eclipsed the 50 threshold (indicating expansion) after 16 straight months below 50 (contraction), all beg the question of why the Fed would see a need to cut rates. As Powell himself said the other day, we have seen an unusual and unforeseen occurrence in which “productive capacity is going up even more than actual output. The economy actually isn't becoming tighter; it's actually becoming a little looser…” Indeed, the “higher for longer” mantra might seem more appropriate, at least on the surface.

Yet despite the rosy outlook and investor confidence/complacency (and Kashkari’s latest comments), the Fed continues to suggest there will be multiple rate cuts this year, as if it knows of something lurking in the shadows. And that something might be a credit crisis stemming from our hyper-financialized/ultra-leveraged economy—and the growing debt burden across government, small business, and consumers being refinanced at today’s high interest rates. We are all aware of the outright depression in commercial real estate today; perhaps there is a contagion lurking. Or perhaps it’s the scary projection for the federal debt/GDP ratio (rising from 97% of GDP last year to 166% by 2054). Or perhaps it is a brewing currency crisis with the Japanese yen, given its historic weakness that may lead the BOJ to hike rates to stem capital outflows. Or perhaps it’s because they follow the real-time “Truflation” estimate, which indicates a year-over-year inflation rate of 1.82% in contrast to the latest headline CPI print of 3.2% and headline PCE of 2.5%.

I discuss all these topics in today’s post, as well as the relative performance of various equity and asset-class ETFs that suggests a nascent market rotation and broadening may be underway, which is a great climate for active managers. Likewise, Michael Wilson of Morgan Stanley asserts that the stock rally since last fall has been driven more by loose financial conditions, extreme liquidity (leverage), and multiple expansion (rather than earnings growth), but now it's time to be a stock picker rather than a passive index investor.

So, if you are looking outside of the cap-weighted passive indexes (and their elevated valuation multiples) for investment opportunities, let me remind you that Sabrient’s actively selected portfolios include the Baker’s Dozen (a concentrated 13-stock portfolio offering the potential for significant outperformance), Small Cap Growth (an alpha-seeking alternative to the Russell 2000 index), and Dividend (a growth plus income strategy paying a 3.74% current yield). The latest Q1 2024 Baker’s Dozen launched on 1/19/24 and remains in primary market until 4/18/24 (and is already well ahead of SPY).

Click here to continue reading my full commentary in which I also discuss Sabrient’s latest fundamentals based SectorCast quantitative rankings of the ten U.S. business sectors (which continue to be led by Technology), current positioning of our sector rotation model (which turned bullish in early November and remains so today), and several top-ranked ETF ideas. Or if you prefer, here is a link to this post in printable PDF format (as some of my readers have requested). Please feel free to share my full post with your friends, colleagues, and clients! You also can sign up for email delivery of this periodic newsletter at Sabrient.com.

By the way, Sabrient founder David Brown has a new book coming out soon through Amazon.com in which he describes his approach to quantitative modeling and stock selection for four distinct investing strategies (Growth, Value, Dividend, and Small Cap). It is concise, informative, and a quick read. David has written a number of books through the years, and in this new one he provides valuable insights for investors by unveiling his secrets to identifying high-potential stocks. Please let me know if you’d like to be an early book reviewer!

Scott Martindale  by Scott Martindale
  President & CEO, Sabrient Systems LLC

The US stock market has gone essentially straight up since late October. While the small-cap Russell 2000 (IWM) surged into year-end 2023, pulled back, and is just now retesting its December high, the mega-cap dominated S&P 500 (SPY) and Nasdaq 100 (QQQ) have both surged almost uninterruptedly to new high after new high. They have both briefly paused a few times to test support at the 20-day moving average but have not come close to testing the 50-day, while the CBOE Volatility Index (VIX) has closed below 16 the entire time. History says this can’t go on much longer.

I think this market rally is getting out over its skis and needs at least a breather if not a significant pullback to cleanse itself of the momentum “algo” traders and FOMO investors and wring out some of this AI-led bullish exuberance. That’s not say we are imminently due for a harsh correction back down to prior support for SPY around 465 (-9%) or to fill the gap on the daily chart from November 13 at 440 (-14%). But it will eventually retest its 200-day moving average, which sits around 450 today but is steadily rising, so perhaps the aforementioned 465 level is good target for a pullback and convergence with the 200-day MA.

Regardless, I believe that short of a Black Swan event (like a terrorist strike on US soil or another credit crisis) that puts us into recession, stocks would recover from any correction to achieve new highs by year-end. As famed economist Ed Yardeni says, “Over the years, we’ve learned that credit crunches, energy crises, and pandemic lockdowns cause recessions. We are looking out for such calamities. But for now, the outlook is for a continuation of the expansion.”

As for bonds, they have been weak so far this year (which pushes up interest rates), primarily because of the “bond vigilantes” who are not happy with the massive issuances of Treasuries and rapidly rising government debt and debt financing costs. So, stocks have been rising even as interest rates rise (and bonds fall), but bonds may soon catch a bid on any kind of talk about fiscal responsibility from our leaders (like Fed chair Powell has intimated).

So, I suspect both stocks and bonds will see more upside this year. In fact, the scene might follow a similar script to last year in which the market was strong overall but endured two significant pullbacks along the way—one in H1 and a lengthier one in H2, perhaps during the summer months or the runup to the election.

Moreover, I don’t believe stocks are in or near a “bubble.” You might be hearing in the media the adage, “If it’s a double, it’s a bubble.” Over the past 16 months since its October 2022 low, the market-leading Nasdaq 100 (QQQ) has returned 72% and the SPY is up 47%. Furthermore, DataTrek showed that, looking back from 1970, whenever the S&P has doubled in any 3-year rolling period (or less), or when the Nasdaq Composite has doubled in any 1-year rolling period, stock prices decline soon after. Well, the rolling 3-year return for the S&P 500 today is at about 30%. And the high-flying Nasdaq 100 is up about 50% over the past year. So, there appears to be no bubble by any of these metrics, and the odds of a harsh correction remain low, particularly in a presidential election year, with the added stimulus of at least a few rate cuts expected during the year.

Meanwhile, while bitcoin and Ethereum prices have surged over the past few weeks to much fanfare, oil has been quietly creeping higher, and gold and silver have suddenly caught a strong bid. As you might recall, I said in my December and January blog posts, “I like the prospects for longer-duration bonds, commodities, oil, gold, and uranium miner stocks this year, as well as physical gold, silver, and cryptocurrency as stores of value.”  I still believe all of these are good holds for 2024. The approval of 11 “spot” ETFs for bitcoin—rather than futures-based or ETNs—was a big win for all cryptocurrencies, and in fact, I hear that major institutions like Bank of America, Wells Fargo, and Charles Schwab (not to mention all the discount brokers) now offer the Bitcoin ETFs—like Grayscale Bitcoin Trust (GBTC) and iShares Bitcoin Trust (IBIT), for example—to their wealth management clients. And they have just begun the process of allocating to those portfolios (perhaps up to the range of 2-5%).

As for inflation, I opined last month that inflation already might be below the 2% target such that the Fed can begin normalizing fed funds rate toward a “neutral rate” of around 3.0% nominal (i.e., 2% target inflation plus 1.0% r-star) versus 5.25–5.50% today. But then the January inflation data showed an uptick. Nonetheless, I think it will prove temporary, and the disinflationary trends will continue to manifest. I discuss this in greater length in today’s post. Also, I still believe a terminal fed funds rate of 3.0% would be appropriate so that borrowers can handle the debt burden while fixed income investors can receive a reasonable real yield (i.e., above the inflation rate) so they don’t have to take on undue risk to achieve meaningful income. As it stands today, I think the real yield is too high—i.e., great for savers but bad for borrowers.

Finally, if you are looking outside of the cap-weighted passive indexes (and their elevated valuation multiples) for investment opportunities, let me remind you that Sabrient’s actively selected portfolios include the Baker’s Dozen (a concentrated 13-stock portfolio offering the potential for significant outperformance), Small Cap Growth (an alpha-seeking alternative to a passive index like the Russell 2000), and Dividend (a growth plus income strategy paying a 3.8% current yield). The new Q1 2024 Baker’s Dozen just launched on 1/19/24.

Click here to continue reading my full commentary in which I also discuss Sabrient’s latest fundamentals based SectorCast quantitative rankings of the ten U.S. business sectors (which continues to be led by Technology), current positioning of our sector rotation model (which turned bullish in early November and remains so today), and several top-ranked ETF ideas. Or if you prefer, here is a link to this post in printable PDF format (as some of my readers have requested). Please feel free to share my full post with your friends, colleagues, and clients! You also can sign up for email delivery of this periodic newsletter at Sabrient.com.

By the way, Sabrient founder David Brown has a new book coming out soon through Amazon.com in which he describes his approach to quantitative modeling and stock selection for four distinct investing strategies. It is concise, informative, and a quick read. David has written a number of books through the years, and in this new one he provides valuable insights geared mostly to individual investors, although financial advisors may find it valuable as well. I will provide more information as we get closer to launch. In the meantime, as a loyal subscriber, please let me know if you’d like to be an early book reviewer!

Scott Martindale  by Scott Martindale
  President & CEO, Sabrient Systems LLC

As an update to some of the topics I discussed in my lengthy early-January post, I wanted to share an update in advance of the FOMC announcement on Wednesday based on several economic reports that were released last week.

The Fed’s preferred inflation metric, Core Personal Consumption Expenditures (PCE, excluding food & energy) for December came in on Friday at 2.93% YoY and 0.17% MoM. However, I prefer to focus on the most recent trend over the past 3 months. Annualizing the Core PCE price index change over the past 3 months (0.14% in Oct, 0.06% in Nov and 0.17% in Dec) computes a 1.52% annualized inflation rate, as shown in the chart below.

So, it appears to me that inflation today is likely below the 2% target such that the Fed can begin normalizing fed funds rate toward the “neutral rate” (neither contractionary nor expansionary), which I believe ultimately will be around 3.0% nominal (i.e., 2% target inflation plus 1.0% r-star) versus 5.25–5.50% today. Moreover, I think the 10-year Treasury will settle at about 4.0–4.50%, assuming we don’t continue flood the Treasury market with new issuances to fund fiscal boondoggles and rising debt service (we’ll get a clue on Wednesday with the Treasury Refunding announcement). The rate levels I am suggesting seem appropriate so that borrowers can handle the debt burden while fixed income investors can receive a reasonable real yield (i.e., above the inflation rate) so they don’t have to take on undue risk to achieve meaningful income.

The Fed believes the composition of PCE more accurately reflects current impacts on consumers than does CPI. This is because it more quickly adapts to consumer choices through its weighting adjustments to individual items (e.g., shifts from pricier brands to discount brands). Also, while CPI narrowly considers only urban expenditures, PCE considers both urban and rural consumers as well as third-party purchases on behalf of a consumer, such as healthcare insurers buying prescription drugs. Furthermore, items are weighted differently—for example, shelter is the largest component of CPI at 32.9% but only 15.9% of PCE, and healthcare is the largest component of PCE at 16.8% but only 7.0% of CPI. So, while Core PCE shows a 1.52% 3-month annualized inflation rate, Core CPI is 3.33%.

So, let's talk more about shelter cost. I have often discussed the lag in shelter cost metrics distorting both PCE and CPI, particularly as new leases gradually roll over throughout the course of a year while existing lease rates persist. So, let me introduce another metric published by the BLS that provides more current insights into the trend in shelter cost, namely the New Tenant Rent Index (NTR).

The NTR data peaked in Q2 2022 while CPI Shelter didn’t peak until Q2 2023. And NTR has fallen precipitously since then, showing a substantial -8.75% quarter-over-quarter decline in Q4 2023 versus Q3 2023. But because such QoQ comparisons can be quite volatile with this metric, I’m not going to annualize that number. Instead, let’s stick with the year-over-year or 4-quarter comparison, which shows a more modest (but still significant) decline of -4.74% versus Q4 2022. Although CPI Shelter index is still elevated, it is also falling (as shown in the chart), now showing a YoY rate of 6.15% for December.

Inflation metrics

Furthermore, the BLS also publishes an All Tenant Regressed Rent Index (ATRR), which is not restricted only to new leases, so it moves more slowly and with less volatility. ATRR also has been in a steady decline since peaking in Q4 2022 at 7.84%, and it has been steadily falling over the past 4 quarters to its latest Q4 2023 reading of 5.27% YoY, which again reflects rapidly falling rental prices and is in-line with CPI Shelter.

This suggests to me that falling shelter costs will soon be more impactful to PCE and CPI readings. The FOMC is surely aware of this.

As for other economic reports last week, we saw the BEA’s advance (first) estimate of Q4 GDP growth surprised to the upside at a 3.3% annual rate, largely driven by personal consumption. Also, the December reading for M2SL money supply shows it has stayed basically flat since last March, while velocity of money (M2V) continues to ramp up. This suggests that more transactions are occurring in the economy for each dollar in circulation, which has offset the negative impact of stagnant money supply, thus supporting GDP, corporate earnings, and stock prices—although lack of M2 growth creates other strains on liquidity. I discuss this further in today’s post below.

Click here to continue reading my full commentary. And please feel free to share my full post with your friends, colleagues, and clients! You also can sign up for email delivery of this periodic newsletter at Sabrient.com.

  Scott Martindaleby Scott Martindale
  President & CEO, Sabrient Systems LLC

To be sure, 2023 was another eventful year (they just keep coming at us, don’t they?), ranging from escalating hot wars to a regional banking crisis, rising interest rates, falling inflation, a dire migration crisis, and an AI-driven frenzy in the so-called “Magnificent Seven” (MAG7) corporate titans— Meta Platforms (META, ne: FB), Apple (AAPL), Nvidia (NVDA), Alphabet (GOOGL), Microsoft (MSFT), Amazon (AMZN), and Tesla (TSLA), aka “FANGMAT,” as I used to call them—which as a group contributed roughly 60% to the S&P 500’s +26.2% gain in 2023. Their hyper-growth means that they now make up roughly 30% of the index. Nvidia (NVDA), whose semiconductors have become essential for AI applications, was the best performer for the full year at +239%.

Small caps finally found some life late in the year, with the Russell 2000 small cap index essentially keeping up with the S&P 500 starting in May and significantly outperforming in December. Bonds also made a big comeback late in the year on Fed-pivot optimism, which allowed the traditional 60/40 stock/bond allocation portfolio to enjoy a healthy return, which I’m sure made a lot of investors and their advisors happy given that 60/40 had been almost left for dead. The CBOE Volatility Index (VIX) has been below 20 for virtually the entirety of 2023 and as low as 11.81 in December, closing the year at 12.45. Also, as a breadth indicator, the percentage of stocks that finished the year above their 200-day moving average hit 75%, which is bullish.

Nevertheless, the Russell 2000 (+16.8%) and the equal-weight version of the S&P 500 (+13.7%) were up much less for the full year than the cap-weighted S&P 500 (+26.2%) and Nasdaq 100 (+54.9%). In fact, 72% of the stocks in the S&P 500 underperformed the overall index for the full year, illustrating that despite the improvement in breadth during the second half of the year, it could not overcome the huge outperformance of a small cohort of dominant companies. This suggests that either the market is set up for a fall in 2024 (as those dominant companies sell off) …or we’ll get a continued broadening into other high-quality companies, including mid- and small caps. I think it will be the latter—but not without some volatility and a significant pullback. Indeed, despite signaling investor confidence and complacency by remaining low for a long stretch, the VIX appears to be ripe for a spike in volatility. I think we could see a significant market correction during H1 (perhaps to as low as 4,500 on the S&P 500) even if, as I expect, real GDP growth slows but remains positive and disinflationary trends continue, supporting real wage growth and real yields—before seeing an H2 rally into (and hopefully following) the November election. And don’t forget there’s a potential tsunami of cash from the $6 trillion held in money market funds, as interest rates fall, much of it may well find its way into stocks.

Not surprisingly, last year ended with some tax-loss harvesting (selling of big losers), and then the new year began last week with some tax-gain harvesting—i.e., selling of big winners to defer tax liability on capital gains into 2024. There also has been some notable rotation of capital last week into 2023’s worst performers that still display strong earnings growth potential and solid prospects for a rebound this year, such as those in the Healthcare, Utilities, and Consumer Staples sectors. Homebuilders remain near all-time highs and should continue to find a tailwind as a more dovish Fed means lower mortgage rates and a possible housing boom. Energy might be interesting as well, particularly LPG shipping (a big winner last year) due to its growing demand in Europe and Asia.

As I discussed in my December commentary, I also like the prospects for longer-duration bonds, commodities, oil, gold, and uranium miner stocks this year, as well as physical gold, silver, and cryptocurrency as stores of value in an uncertain macro climate. Also, while Chinese stocks are near 4-year lows, many other international markets are near multi-year highs (including Europe and Japan), particularly as central banks take a more accommodative stance. Indeed, Sabrient’s SectorCast ETF rankings show high scores for some international-focused ETFs (as discussed later in this post).

While stocks rallied in 2023 (and bonds made a late-year comeback) mainly due to speculation on a Fed pivot toward lower interest rates (which supports valuations), for 2024 investors will want to see more in the way of actual earnings growth and other positive developments for the economy. I expect something of a “normalization” away from extreme valuation differentials and continued improvement in market breadth, whether it’s outperformance by last year’s laggards or a stagnation/pullback among last year’s biggest winners (especially if there are fewer rate cuts than anticipated)—or perhaps a bit of both. Notably, the S&P 500 historically has risen 20 of the last 24 election years (83%); however, a recent Investopedia poll shows that the November election is the biggest worry among investors right now, so it’s possible all the chaos, wailing and gnashing of teeth about Trump’s candidacy will make this election year unique with respect to stocks.

Regardless, I continue to believe that investors will be better served this year by active strategies that can identify and exploit performance dispersion among stocks across the capitalization spectrum—particularly smaller caps and the underappreciated, high-quality/low-valuation growers. Small caps tend to carry debt and be more sensitive to interest rates, so they have the potential to outperform when interest rates fall, but you should focus on stocks with an all-weather product line, a robust growth forecast, a solid balance sheet, and customer loyalty, which makes them more likely to withstand market volatility—which may well include those must-have, AI-oriented Tech stocks. Much like the impact of the Internet in the 1990s, AI/ML, blockchain/distributed ledger technologies (DLTs), and quantum computing appear to be the “it” technologies of the 2020’s that make productivity and efficiency soar. However, as I discuss in today’s post, the power requirements will be immense and rise exponentially. So, perhaps this will add urgency to what might become the technology of the 2030’s—i.e., nuclear fusion.

On that note, let me remind you that Sabrient’s actively selected portfolios include the Baker’s Dozen (a concentrated 13-stock portfolio offering the potential for significant outperformance), Small Cap Growth (an alpha-seeking alternative to a passive index like the Russell 2000), and Dividend (a growth plus income strategy paying a 4.5% current yield).

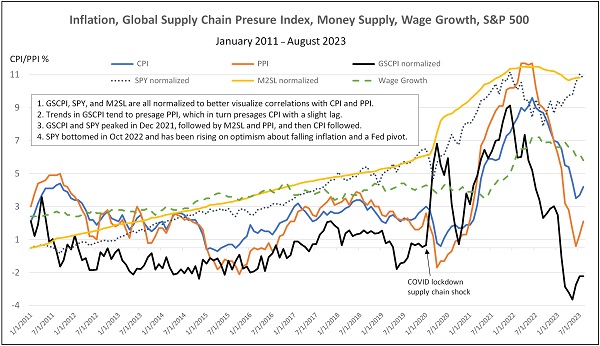
By the way, several revealing economic reports were released last week, which I discuss in today’s post. One was the December reading on the underappreciated New York Federal Reserve Global Supply Chain Pressure Index (GSCPI), which has fallen precipitously from it pandemic-era high and now is fluctuating around the zero line. This historically suggests falling inflation readings ahead. As for the persistently inverted yield curve, I continue to believe it has more to do with the unprecedented supply chain shocks coupled with massive fiscal and monetary stimulus to maintain demand and the resulting surge in inflation, which as observed by Alpine Macro, “makes the inversion more reflective of different inflation expectations than a signal for an impending recession.”

Also, although M2 money supply fell -4.6% from its all-time high in July 2022 until its low in April 2023, it has essentially flatlined since then and in fact has been largely offset to a great extent by an increase in the velocity of money supply. Also, we have a robust jobs market that has slowed but is far from faltering. And then there is the yield curve inversion that has been gradually flattening from a low of about -108 bps last July to -35 bps today.

I discuss all of this in greater detail in today’s post, including several illustrative tables and charts. I also discuss Sabrient’s latest fundamentals based SectorCast quantitative rankings of the ten U.S. business sectors (which is topped by Technology), current positioning of our sector rotation model (which turned bullish in early November and remains so), and some actionable ETF trading ideas.

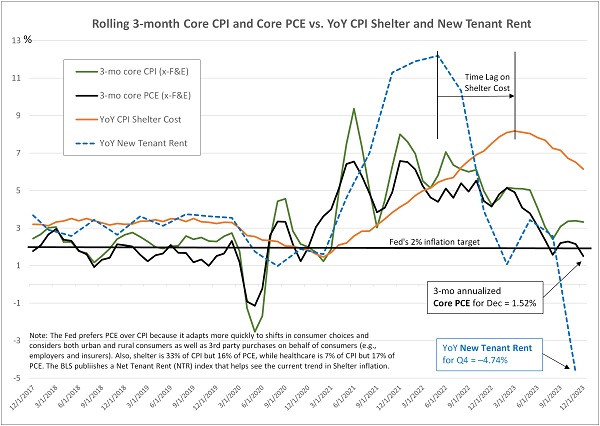
Overall, I expect inflation will resume its decline, even with positive GDP growth, particularly given stagnant money supply growth, mending and diversifying supply chains (encompassing manufacturing, transportation, logistics, energy, and labor), falling or stabilizing home sale prices and new leases, slowing wage inflation, slower consumer spending on both goods and services, and a strong deflationary impulse from China due to its economic malaise and “dumping” of consumer goods to shore up its manufacturing (US imports from China were down 25% in 2023 vs. 2022). This eventually will give the Fed (and indeed, other central banks) license to begin cutting rates—likely by mid-year, both to head off renewed crises in banking and housing and to mitigate growing strains on highly leveraged businesses, consumers, government, and trading partners. Current CBOE fed funds futures suggest a 98% chance of at least 100 bps in rate cuts by year end (target rate of 4.25-4.50%), and 54% chance of at least 150 bps.

Click here to continue reading my full commentary … or if you prefer, here is a link to this post in printable PDF format (as some of my readers have requested). And please feel free to share my full post with your friends, colleagues, and clients! You also can sign up for email delivery of this periodic newsletter at Sabrient.com

Scott Martindale  by Scott Martindale
  President & CEO, Sabrient Systems LLC

Federal shutdown averted, at least for another 6 weeks, which may give investors some optimism that cooler heads will prevail in the nasty tug-of-war between the budget hawks and the spendthrifts on the right and left flanks. Nevertheless, I think stocks still may endure some turmoil over the next few weeks before the historically bullish Q4 seasonality kicks in—because, yes, there are still plenty of tailwinds.

From a technical standpoint, at the depths of the September selloff, 85% of stocks were trading below their 50-day moving averages, which is quite rare, and extreme September weakness typically leads to a strong Q4 rally. And from a fundamental standpoint, corporate earnings expectations are looking good for the upcoming Q3 reporting season and beyond, as analysts are calling for earnings growth of 12.2% in 2024 versus 2023, according to FactSet. But that still leaves us with the interest rate problem—for the economy and federal debt, as well as valuation multiples (e.g., P/E) and the equity risk premium—given that my “line in the sand” for the 2-year Treasury yield at the 5% handle has been solidly breached.

But the good news is, we learned last week that the Fed’s preferred inflation metric, core PCE (ex-food & energy), showed its headline year-over-year (YoY) reading fall to 3.9% in August (from 4.3% in July). And more importantly in my view, it showed a month-over-month (MoM) reading of only 0.14%, which is a better indicator of the current trend in consumer prices (rather than comparing to prices 12 months ago), which annualizes to 1.75%—which of course is well below the Fed’s 2% inflation target. Even if we smooth the last 3 MoM reports for core PCE of 0.17% in June, 0.22% in July, and 0.14% in August, the rolling 3-month average annualizes to 2.16%. Either way, it stands in stark contrast to the upward reversal in CPI that previously sent the FOMC and stock and bond investors into a tizzy.

Notably, US home sales have retreated shelter costs have slowed, wage inflation is dropping, and China is unleashing a deflationary impulse by dumping consumer goods and parts on the global market in a fit of desperation to maintain some semblance of GDP growth while its critical real estate market teeters on the verge of implosion.

So, core inflation is in a downtrend while nominal interest rates are rising, which is rapidly driving up real rates, excessively strengthening the dollar, threatening our economy, and contributing to distress among our trading partners and emerging markets—including capital flight, destabilization, and economic migration. Also, First Trust is projecting interest on federal debt to hit 2.5% of GDP by year-end, up sharply from 1.85% last year (which was the highest since 2001 during a steep decline from its 1991 peak of 3.16%).

Therefore, I believe the Fed is going to have to lighten up soon on hawkish rate policy and stagnant/falling money supply. When the Fed decides it’s time to cut rates—both to head off escalating crises in banking and housing and to mitigate growing strains on highly leveraged businesses, consumers, and foreign countries (from an ultra-strong dollar and high interest rates when rolling maturing debt)—it would be expected to ignite a sustained rally in both stocks and bonds.

But even if the AI-leading, Big Tech titans can justify their elevated valuations with extraordinary growth—and according to The Market Ear, they trade at the largest discount to the median stock in the S&P 500 stock in over 6 years on a growth-adjusted basis—investors still may be better served by active strategies that exploit improving market breadth by seeking “under the radar” opportunities poised for explosive growth, rather than the broad passive indexes. So, we believe this is a good time to be invested in Sabrient’s portfolios—including the new Q3 2023 Baker’s Dozen (launched on 7/20), Forward Looking Value 11 (launched on 7/24), Small Cap Growth 39 (launched on 8/7), and Sabrient Dividend 45 (launched on 9/1 and today offers a 5.5% dividend yield).

In today’s post, I discuss inflation, stock-bond relative performance, equity valuations, and Fed monetary policy implications. I also discuss Sabrient’s latest fundamentals based SectorCast quantitative rankings of the ten U.S. business sectors (which continues to be topped by Technology and Energy), current positioning of our sector rotation model (neutral bias), and some actionable ETF trading ideas. Your feedback is always welcome!

Click here to continue reading my full commentary … or if you prefer, here is a link to this post in printable PDF format (as some of my readers have requested).

Scott Martindale  by Scott Martindale
  President & CEO, Sabrient Systems LLC

Given the latest inflation reports last week and this week’s FOMC meeting, I thought I would offer up some perspective today in a short post. Although there are plenty of other issues to worry about, including the historic auto workers’ strike and an impending federal government shutdown, all eyes are focused on the Fed’s reaction to inflation and jobs reports in the form of monetary policy, specifically interest rates and money supply.

The 2-year yield again has been battling the important 5% threshold, which I have called a “line in the sand” for stocks. After challenging the March and July highs above 5% during August, it had appeared to me that it was just another buyable bond selloff, driven by the various reasons I discussed in my 9/1/2023 post. Indeed, yields pulled back substantially to end the month of August, as both bond and stock prices rose. But this month’s renewed weakness in bonds (and the rise in yields) suggests a “buyer’s strike” as investors generally have been moving to cash ahead of this week’s FOMC meeting. At the moment, resistance at the 5-handle seems to have given way, with the rate now at 5.10% as I write (and stocks are weak).

To be sure, last week’s inflation reports gave mixed signals. CPI and PPI both ticked up from their June lows of 3.0% and 0.1%, respectively, to August readings of 3.7% and 1.6%, which appear troubling to the Fed’s ongoing inflation fight. Certainly, the recent surge in oil prices to above $90 has hurt the cause, as has the stubborn shelter cost component, which makes up 42% of CPI. In addition, Mexico’s rise as a “near-shore” manufacturing hub for the US, its extreme wage inflation, and the extraordinary strength of the peso has increased prices of its exports to the US.

On the other hand, rising oil prices are like a tax on consumers, limiting their disposable income to buy other things. Same with the imminent student loan payment restart. Also, core rates (ex-food and energy) for CPI and PPI both fell to 4.3% and 2.2%, respectively. And given the emerging “lag effects” of rising interest rates on rents and owner’s equivalent rent (OER), many economists expect shelter costs to begin to decline very soon. Indeed, by Q4 2024, JPMorgan chief global strategist David Kelly expects both headline and core PCE to fall below the Fed’s 2% target and perhaps hit 1.5%, largely driven by declines in shelter costs, new and used car prices, auto insurance, and car maintenance. 

Below is an updated version of a chart I present from time to time. It compares trends in CPI and PPI versus the New York Fed’s Global Supply Chain Pressure Index (GSCPI), which measures the number of standard deviations from the historical average value. It also shows wage growth, M2 money supply (M2SL), and the S&P 500 (SPY). I know the chart is busy, but it tells a good story.

Inflation, Supply Chains, and S&P 500

Read on....

Scott Martindale  by Scott Martindale
  President & CEO, Sabrient Systems LLC

Stocks and bonds both sold off in August before finishing the month with a flourish, as signs that the jobs market is weakening suggest an end to Fed rate hikes is nigh. The summer correction in equities was entirely expected after the market’s extraordinary display of strength for the first seven months of the year in the face of a relentlessly hawkish Federal Reserve, even as CPI and PPI have fallen precipitously. State Street’s Institutional Investor Risk Appetite Indicator moved dramatically from bearish in May to highly bullish at the end of July, and technical conditions were overbought. And although the depth of the correction took the bulls by surprise, it was quite orderly with the CBOE Volatility Index (VIX) staying tame (i.e., never even approaching the 20 handle). In fact, a 5% pullback in the S&P 500 is not unusual given the robust 20% YTD return it had attained in those seven months. Weakness in bonds, gold, and commodity prices also reversed.

Moreover, IG, BBB, and HY bond spreads have barely moved during this market pullback despite rising real rates, which signals that the correction in stocks is more about valuations in the face of the sudden spike in interest rates (and fears of “higher for longer”) rather than the health of the economy, earnings, or fundamentals. Certainly, the US economy looks much stronger than any of our trading partners (which Fed chair Powell seems none too happy about), with the Atlanta Fed’s GDPNow model estimating a robust 5.6% growth for Q3 (as of 8/31) and the dollar surging in a flight to safety [in fact, the US Dollar Index Fund (UUP) recently hit a 2023 high].

However, keep in mind that the US is not an island unto itself but part of a complex global economy and thus not immune to contagion, so the GDP growth rate will likely come down. Moreover, Powell said in his Jackson Hole speech that the Fed’s job is “complicated by uncertainty about the duration of the lags with which monetary tightening affects economic activity and especially inflation.”

Investors have generally retained their enthusiasm about stocks despite elevated valuations, rising real interest rates (creating a long-lost viable alternative to stocks—and a poor climate for gold), a miniscule equity risk premium, and a Fed seemingly hell-bent on inducing recession in order to crush sticky core inflation. Perhaps stock investors have been emboldened by the unstoppable secular force of artificial intelligence (AI) and its immediate benefits to productivity and profitability (not just “hope”)—as evidenced by Nvidia’s (NVDA) incredible earnings release last week.

I have discussed in recent posts about how the Bull case seems to outweigh the (highly credible) Bear case. However, the key tenets of the Bull case—and avoidance of recession—include a stable China. Since 2015, I have been talking about a key risk to the global economy being the so-called “China Miracle” gradually being exposed as a House of Cards, and perhaps never before has it seemed so close to implosion, as it tests the limits of debt-fueled growth—and a creeping desperation coupled with an inability (or unwillingness) to pivot sharply from its longstanding policies makes it even more dangerous. I talk more about this in today’s post.

Yet despite all the significant challenges and uncertainties, I still believe stocks are in a normal/predictable summer consolidation—particularly after this year’s surprisingly strong market performance through July—with more upside to come. My only caveat has been that the 2-year Treasury yield needs to remain below 5%—a critical “line in the sand,” so to speak. Although I (and many others) often cite the 10-year yield because of its link to mortgage rates, I think the 2-year is important because it reflects a broad expectation of inflation and the duration of the Fed’s “higher for longer” policy. Notably, during this latest spike in rates, the 2-year again eclipsed that critical 5-handle for the third time this year and challenged the 7/5 intraday high of 5.12%, before pulling back sharply to close the month below 4.9%.

If the 2-year reverses again and surges to new highs, I think it threatens a greater impact on our economy (as well as our trading partners’) as businesses, consumers, and governments manage their maturing lower-rate debt—and ultimately impacts the housing market and risk assets, like stocks. But instead, I see it as just another short-term rate spike like we saw in March and July, as investors sort out the issues described in my full post below. Indeed, August finished with a big fall in rates in concert with a big jump in stocks, gold, crypto, and other risk assets across the board, as cracks in the jobs and housing markets are showing up, leading to a growing belief that the Fed is finished with its rate hikes—as I think they should be, particularly given the resumption of disinflationary secular trends and a deflationary impulse from China.

Some economists believe that extreme stock valuations and the ultra-low equity risk premium are pricing in both rising earnings and falling rates—an unlikely duo, in their view, on the belief that a strong economy is inherently inflationary while a weakening economy suggests lower earnings—and thus, recession is inevitable. But I disagree. For one, respected economist Ed Yardeni has observed that we have already been in the midst of a “rolling recession” across segments of the economy that is now turning into a “rolling expansion.” And regarding elevated valuations in the major indexes, my observation is that they are primarily driven by a handful of mega-cap Tech names. Minus those, valuations across the broader market are much more reasonable, as I discuss in today’s post.

Indeed, rather than passive positions in the broad market indexes, investors may be better served by strategies that seek to exploit improving market breadth and the performance dispersion among individual stocks. Sabrient’s portfolios include Baker’s Dozen, Forward Looking Value, Small Cap Growth, and Dividend, each of which provides exposure to market segments and individual companies that our models suggest may outperform. Let me know how I can better serve your needs, including speaking at your events (whether by video or in person).

As stocks and other risk assets finish what was once destined to be a dismal month with a show of renewed bullish conviction, allow me to step through in greater detail some of the key variables that will impact the market through year-end and beyond, including the economy, valuations, inflation, Fed policy, the dollar, and China…and why I remain bullish. I also review Sabrient’s latest fundamentals based SectorCast quant rankings of the ten U.S. business sectors (topped by Technology and Energy) and serve up some actionable ETF trading ideas.

Click here to continue reading my full commentary … or if you prefer, here is a link to my full post in printable PDF format (as some of my readers have requested).

Scott Martindale  by Scott Martindale
  President & CEO, Sabrient Systems LLC

I have been expecting elevated volatility, and it has surely arrived. The CBOE Volatility Index (VIX) briefly spiked above 35 on 12/3 before settling back down below 20 last week as stocks resurged. Given lofty valuations (S&P 500 at 21.4x forward P/E) that appear to be pricing in continued economic recovery and strong corporate earnings further exceeding expectations, any hint of new obstacles – like onerous new COVID variants, renewed lockdowns, persistent supply chain disruptions, anemic jobs report, or relentless inflationary pressures – naturally sends fidgety investors to the sell button on their keyboards, at least momentarily. And now we learn that the Fed might have joined the legions of dour pundits by removing the word “transitory” from its inflation description while hastening its timetable for QE tapering (but don’t call it QE!) and interest rate hikes. Nevertheless, despite the near-term challenges that likely will lead to more spikes in volatility, investors are buying the dip, and I believe the path of least resistance is still higher for stocks over the medium term, but with a greater focus on quality rather than speculation.

However, investors are going to have to muster up stronger bullish conviction for the market to achieve a sustainable upside breakout. Perhaps Santa will arrive on queue to help. But with this new and unfamiliar uncertainty around Fed monetary policy, and with FOMC meeting and announcement later this week combined with an overbought technical picture (as I discuss in today’s post below), I think stocks may pull back into the FOMC meeting – at which time we should get a bit more clarity on its intentions regarding tapering of its bond buying and plan for interest rate hikes. Keep in mind, the Fed still insists that “tapering is not tightening,” i.e., they remain accommodative.

The new hawkish noises from the Fed came out of left field to most observers, and many growth stocks took quite a hit. Witness the shocking 42% single-day haircut on 12/3 for a prominent company like DocuSign (DOCU), for example. And similar things have happened to other such high-potential but speculative/low-quality names, many of which are held by the ARK family of ETFs. In fact, of the 1,086 ETFs scored by Sabrient’s fundamentals based SectorCast rankings this week, most of Cathie Woods’ ARK funds are ranked at or near the bottom.

Although I do not necessarily see DOCU and its ilk as the proverbial canary in the coal mine for the broader market, it does serve to reinforce that investors are displaying a greater focus on quality as the economy has moved past the speculative recovery phase, which is a healthy development in my view. In response, we have created the Sabrient Quality Index Series comprising 5 broad-market and 5 sector-specific, rules-based, strategic beta and thematic indexes for ETF licensing, which we are pitching to various ETF issuers. Moreover, we continue to suggest staying long but hedged, with a balance between 1) value/cyclicals and 2) high-quality secular growers & dividend payers. Hedges might come from inverse ETFs, out-of-the-money put options, gold, and cryptocurrencies (I personally hold all of them).

In this periodic update, I provide a comprehensive market commentary, offer my technical analysis of the S&P 500 chart, review Sabrient’s latest fundamentals based SectorCast quant rankings of the ten US business sectors, and serve up some actionable ETF trading ideas. To summarize, our SectorCast rankings reflect a highly bullish bias, with the top two scorers being deep-cyclical sectors, Basic Materials and Energy, which are seeing surging forward EPS estimates and ultra-low forward PEG ratios (forward P/E divided by projected EPS growth rate) under 0.50. In addition, the technical picture is somewhat mixed and suggestive of a near-term pullback, although our sector rotation model maintains its bullish posture.

By the way, Sabrient’s latest Q4 2021 Baker’s Dozen model portfolio is already displaying solid performance despite having a small-cap bias and equal weighted position sizes that would typically suggest underperformance during periods of elevated market volatility. It is up +5.3% since its 10/20/2021 launch through 12/10/2021 versus +4.1% for the cap-weighted S&P 500, +1.2% for the equal-weight S&P 500, and -3.3% for the Russell 2000. Also, last year’s Q4 2020 Baker’s Dozen model portfolio, which terminates next month on 1/20/2022, is looking good after 14 months of life with a gross return of +43%. As a reminder, our various portfolios – including Baker’s Dozen, Small Cap Growth, and Dividend – all employ our enhanced growth-at-a-reasonable-price (aka GARP) approach that combines value, growth, and quality factors while seeking a balance between secular growth and cyclical/value stocks and across market caps. Read on....

Scott Martindale  by Scott Martindale
  President & CEO, Sabrient Systems LLC

I mentioned early last month that it had been quite a long stretch since the market had seen even a -5% correction, but we finally got it, with the S&P 500 falling -6% (intraday). Although many commentators (including myself) felt we needed even more of a correction in the major market indexes to really wring out some excesses and the “weak” holders, the underlying internals tell a different story of a much harsher “stealth” correction. Alpine Macro reported that 90% of the stocks in the S&P 500 have fallen at least -10% from their recent highs, with an average decline of -17% … and -38% in the Nasdaq Composite! A casual observer might not have noticed this since these individual stock corrections didn’t occur all at once, but rather in more of a rolling fashion as various industries fell in and out of favor at different times. The masking by the major indexes of these underlying corrections is the magic of passive index investing, as the diversification limits downside (albeit upside as well, of course).

Moreover, while the cap-weighted indexes have surged to new highs as recently as early September, the equal-weight and small-cap indexes have been trading sideways since March. Regardless, investors took the September correction as a buyable dip. Last Thursday-Friday provided two bullish breakout gaps, and in fact Thursday was the strongest day for the S&P 500 since March. Looking ahead, the question is whether the rapid 2-day surge is sustainable, or if there is some technical consolidation (aka “backing & filling”) to be done – or perhaps something much worse, as several prominent Wall Street veterans have predicted.

No doubt, economic challenges abound. Energy prices are surging. COVID persists in much of the world, especially emerging markets, which is at least partly responsible for the persistent supply chain issues and labor shortages in the manufacturing and transportation segments that are proving slow to resolve. Retail and restaurant industries continue to have difficulty filling jobs (and they are seeing a high rate of “quits”). And now we are seeing fiscal and monetary tightening in China – likely leading to lower GDP growth (if not a “hard landing”) – due to long-festering financial leverage and “shadow banking” finally coming to roost (witness the Evergrande property development debacle, and now it appears developer Modern Land is next). Indeed, we see many similarities with Q4 2018 (including the S&P 500 price chart), when the market endured a nasty selloff. Investors should be mindful of these risks. So, although TINA-minded (“there is no alternative”) equity investors continue to pour money into stocks, and an exuberant FOMO (“fear of missing out”) melt-up is possible going into year-end, there likely will be elevated volatility.

I write in greater depth about oil prices and China’s troubles in this article.

Q3 earnings reporting season is now underway, and I expect the number and magnitude of upside surprises and forward guidance will determine the next directional trend. In any case, we continue to like the Energy sector, even after its recent run (in fact, you will find a couple of oil exploration & production firms in the new Baker’s Dozen coming out this week). Wall Street estimates in the sector still appear to be too low based on projected prices, and the dividend yields are attractive. Sabrient’s SectorCast ETF rankings continue to show Energy at or near the top. Actually, from a broader perspective, the “deep cyclical” sectors (especially Energy, Materials, and Industrials), with their more volatile revenue streams but relatively fixed (albeit high) cost structure (and high earnings leverage), remain well positioned to show strong sales growth and, by extension, upside earnings surprises.

In this periodic update, I provide a comprehensive market commentary, offer my technical analysis of the S&P 500 chart, review Sabrient’s latest fundamentals based SectorCast quant rankings of the ten US business sectors, and serve up some actionable ETF trading ideas. To summarize, our SectorCast rankings reflect a solidly bullish bias; the technical picture is somewhat mixed; and our sector rotation model has regained its bullish posture (pending technical confirmation early this week).

By the way, Sabrient’s new Q4 2021 Baker’s Dozen launches on Wednesday, 10/20/21. As a reminder, our newer portfolios – including Baker’s Dozen, Small Cap Growth, Dividend, and Forward Looking Value – all reflect the process enhancements we implemented in December 2019 in response to the unprecedented market distortions that created historic Value/Growth and Small/Large performance divergences. Our enhanced growth-at-a-reasonable-price (aka GARP) approach combines value, growth, and quality factors while seeking a balance between secular growth and cyclical/value stocks and across market caps.  Read on....

Scott Martindale  by Scott Martindale
  President & CEO, Sabrient Systems LLC

Another positive month for the major indexes, despite plenty of new bricks in the proverbial Wall of Worry. That makes 7 months in a row – the longest streak in over 30 years – and 14 of the past 17 months (since the pandemic low). From a technical (chart) perspective, the S&P 500 has tested its 50-day simple moving average seven times this year, each time going on to hit a new high. And it’s not just the cap-weighted index (SPY) as the equal-weight version (RSP) has been moving in lockstep, illustrating good market breadth and confirming market conviction. Stocks seem to have already priced in some modest tapering of asset purchases by year end, so in the wake of Fed chairman Powell’s late-August speech in Jackson Hole indicating no plans for rate hikes, stocks surged yet again. Indeed, it has become a parabolic “melt-up,” which of course cannot go on forever.

Many investors have been patiently awaiting a significant market correction to use as a buying opportunity, but it remains elusive. What happened to the typical August low-volume technical correction? The big money institutions and hedge funds certainly have stuck to the script by reducing equity exposure and increasing exposure to volatility. But retail investors didn’t get the memo as every time it appears the correction has begun, they treat it like a buyable dip – not just in meme stocks but also the disruptive, secular-growth Tech stocks that so dominate total market cap and the cap-weighted, broad-market indexes. It seems like yet another market distortion caused by government intervention and de facto Modern Monetary Theory (MMT) that has flooded the economy with free money and kept workers at home to troll on social media, gamble on DraftKings, and speculate in Dogecoin, NFTs, SPACs, and meme stocks.

Will September finally bring a significant (and overdue) correction, or will the dip buyers, led by an active, brash, and risk-loving retail investor, continue to scare off the short sellers and prop up the market? Is this week’s pullback yet another head fake? And regardless, will the S&P 500 (both cap-weight and equal-weight) finish the year higher than last week’s all-time highs?

There is little doubt in my mind that the big institutional investors continue to wait patiently in the tall grass like a cheetah to pounce on any significant market weakness, like a 10+% selloff. Valuations are dependent on earnings, interest rates, and the equity risk premium (ERP, i.e., earnings yield minus the risk-free rate), and today we have robust corporate earnings, rising forward guidance, persistently low interest rates, a dovish Fed, and a low ERP – which is related to inflation expectations that are much lower than recent CPI readings would have you expect. I continue to expect inflation to moderate in 2022 while interest rates remain constrained by a stable dollar and Treasury demand. The Fed’s ongoing asset purchases (despite some expected tapering) along with robust demand among global investors (due to global QE and low comparative yields) has put a bid under bonds and kept nominal long term yields low (albeit with negative real yields). Indeed, bond yields today are less sensitive to inflationary signals compared to the past.

In this periodic update, I provide a comprehensive market commentary, offer my technical analysis of the S&P 500 chart, review Sabrient’s latest fundamentals based SectorCast quant rankings of the ten US business sectors, and serve up some actionable ETF trading ideas. To summarize, our SectorCast rankings reflect a solidly bullish bias; the technical picture has been strong but remains in dire need of significant (but healthy and buyable, in my view) correction; and our sector rotation model retains its bullish posture. We continue to believe in having a balance between value/cyclicals and secular growth stocks and across market caps, although defensive investors may prefer an overweight on large-cap, secular-growth Tech and high-quality dividend payers.

As a reminder, we post my latest presentation slide deck and Baker’s Dozen commentary on our public website.) Sabrient’s newer portfolios – including Q3 2021 Baker’s Dozen, Small Cap Growth, Dividend, and Forward Looking Value– all reflect the process enhancements that we implemented in December 2019 in response to the unprecedented market distortions that created historic Value/Growth and Small/Large performance divergences. With a better balance between cyclical and secular growth and across market caps, most of our newer portfolios once again have shown solid performance relative to the benchmark during quite a range of evolving market conditions.

By the way, I welcome your comments, feedback, or just a friendly hello!  Read on….

Pages