Scott Martindale  by Scott Martindale
  President & CEO, Sabrient Systems LLC

As an update to some of the topics I discussed in my lengthy early-January post, I wanted to share an update in advance of the FOMC announcement on Wednesday based on several economic reports that were released last week.

The Fed’s preferred inflation metric, Core Personal Consumption Expenditures (PCE, excluding food & energy) for December came in on Friday at 2.93% YoY and 0.17% MoM. However, I prefer to focus on the most recent trend over the past 3 months. Annualizing the Core PCE price index change over the past 3 months (0.14% in Oct, 0.06% in Nov and 0.17% in Dec) computes a 1.52% annualized inflation rate, as shown in the chart below.

So, it appears to me that inflation today is likely below the 2% target such that the Fed can begin normalizing fed funds rate toward the “neutral rate” (neither contractionary nor expansionary), which I believe ultimately will be around 3.0% nominal (i.e., 2% target inflation plus 1.0% r-star) versus 5.25–5.50% today. Moreover, I think the 10-year Treasury will settle at about 4.0–4.50%, assuming we don’t continue flood the Treasury market with new issuances to fund fiscal boondoggles and rising debt service (we’ll get a clue on Wednesday with the Treasury Refunding announcement). The rate levels I am suggesting seem appropriate so that borrowers can handle the debt burden while fixed income investors can receive a reasonable real yield (i.e., above the inflation rate) so they don’t have to take on undue risk to achieve meaningful income.

The Fed believes the composition of PCE more accurately reflects current impacts on consumers than does CPI. This is because it more quickly adapts to consumer choices through its weighting adjustments to individual items (e.g., shifts from pricier brands to discount brands). Also, while CPI narrowly considers only urban expenditures, PCE considers both urban and rural consumers as well as third-party purchases on behalf of a consumer, such as healthcare insurers buying prescription drugs. Furthermore, items are weighted differently—for example, shelter is the largest component of CPI at 32.9% but only 15.9% of PCE, and healthcare is the largest component of PCE at 16.8% but only 7.0% of CPI. So, while Core PCE shows a 1.52% 3-month annualized inflation rate, Core CPI is 3.33%.

So, let's talk more about shelter cost. I have often discussed the lag in shelter cost metrics distorting both PCE and CPI, particularly as new leases gradually roll over throughout the course of a year while existing lease rates persist. So, let me introduce another metric published by the BLS that provides more current insights into the trend in shelter cost, namely the New Tenant Rent Index (NTR).

The NTR data peaked in Q2 2022 while CPI Shelter didn’t peak until Q2 2023. And NTR has fallen precipitously since then, showing a substantial -8.75% quarter-over-quarter decline in Q4 2023 versus Q3 2023. But because such QoQ comparisons can be quite volatile with this metric, I’m not going to annualize that number. Instead, let’s stick with the year-over-year or 4-quarter comparison, which shows a more modest (but still significant) decline of -4.74% versus Q4 2022. Although CPI Shelter index is still elevated, it is also falling (as shown in the chart), now showing a YoY rate of 6.15% for December.

Inflation metrics

Furthermore, the BLS also publishes an All Tenant Regressed Rent Index (ATRR), which is not restricted only to new leases, so it moves more slowly and with less volatility. ATRR also has been in a steady decline since peaking in Q4 2022 at 7.84%, and it has been steadily falling over the past 4 quarters to its latest Q4 2023 reading of 5.27% YoY, which again reflects rapidly falling rental prices and is in-line with CPI Shelter.

This suggests to me that falling shelter costs will soon be more impactful to PCE and CPI readings. The FOMC is surely aware of this.

As for other economic reports last week, we saw the BEA’s advance (first) estimate of Q4 GDP growth surprised to the upside at a 3.3% annual rate, largely driven by personal consumption. Also, the December reading for M2SL money supply shows it has stayed basically flat since last March, while velocity of money (M2V) continues to ramp up. This suggests that more transactions are occurring in the economy for each dollar in circulation, which has offset the negative impact of stagnant money supply, thus supporting GDP, corporate earnings, and stock prices—although lack of M2 growth creates other strains on liquidity. I discuss this further in today’s post below.

Click here to continue reading my full commentary. And please feel free to share my full post with your friends, colleagues, and clients! You also can sign up for email delivery of this periodic newsletter at Sabrient.com.

  Scott Martindaleby Scott Martindale
  President & CEO, Sabrient Systems LLC

To be sure, 2023 was another eventful year (they just keep coming at us, don’t they?), ranging from escalating hot wars to a regional banking crisis, rising interest rates, falling inflation, a dire migration crisis, and an AI-driven frenzy in the so-called “Magnificent Seven” (MAG7) corporate titans— Meta Platforms (META, ne: FB), Apple (AAPL), Nvidia (NVDA), Alphabet (GOOGL), Microsoft (MSFT), Amazon (AMZN), and Tesla (TSLA), aka “FANGMAT,” as I used to call them—which as a group contributed roughly 60% to the S&P 500’s +26.2% gain in 2023. Their hyper-growth means that they now make up roughly 30% of the index. Nvidia (NVDA), whose semiconductors have become essential for AI applications, was the best performer for the full year at +239%.

Small caps finally found some life late in the year, with the Russell 2000 small cap index essentially keeping up with the S&P 500 starting in May and significantly outperforming in December. Bonds also made a big comeback late in the year on Fed-pivot optimism, which allowed the traditional 60/40 stock/bond allocation portfolio to enjoy a healthy return, which I’m sure made a lot of investors and their advisors happy given that 60/40 had been almost left for dead. The CBOE Volatility Index (VIX) has been below 20 for virtually the entirety of 2023 and as low as 11.81 in December, closing the year at 12.45. Also, as a breadth indicator, the percentage of stocks that finished the year above their 200-day moving average hit 75%, which is bullish.

Nevertheless, the Russell 2000 (+16.8%) and the equal-weight version of the S&P 500 (+13.7%) were up much less for the full year than the cap-weighted S&P 500 (+26.2%) and Nasdaq 100 (+54.9%). In fact, 72% of the stocks in the S&P 500 underperformed the overall index for the full year, illustrating that despite the improvement in breadth during the second half of the year, it could not overcome the huge outperformance of a small cohort of dominant companies. This suggests that either the market is set up for a fall in 2024 (as those dominant companies sell off) …or we’ll get a continued broadening into other high-quality companies, including mid- and small caps. I think it will be the latter—but not without some volatility and a significant pullback. Indeed, despite signaling investor confidence and complacency by remaining low for a long stretch, the VIX appears to be ripe for a spike in volatility. I think we could see a significant market correction during H1 (perhaps to as low as 4,500 on the S&P 500) even if, as I expect, real GDP growth slows but remains positive and disinflationary trends continue, supporting real wage growth and real yields—before seeing an H2 rally into (and hopefully following) the November election. And don’t forget there’s a potential tsunami of cash from the $6 trillion held in money market funds, as interest rates fall, much of it may well find its way into stocks.

Not surprisingly, last year ended with some tax-loss harvesting (selling of big losers), and then the new year began last week with some tax-gain harvesting—i.e., selling of big winners to defer tax liability on capital gains into 2024. There also has been some notable rotation of capital last week into 2023’s worst performers that still display strong earnings growth potential and solid prospects for a rebound this year, such as those in the Healthcare, Utilities, and Consumer Staples sectors. Homebuilders remain near all-time highs and should continue to find a tailwind as a more dovish Fed means lower mortgage rates and a possible housing boom. Energy might be interesting as well, particularly LPG shipping (a big winner last year) due to its growing demand in Europe and Asia.

As I discussed in my December commentary, I also like the prospects for longer-duration bonds, commodities, oil, gold, and uranium miner stocks this year, as well as physical gold, silver, and cryptocurrency as stores of value in an uncertain macro climate. Also, while Chinese stocks are near 4-year lows, many other international markets are near multi-year highs (including Europe and Japan), particularly as central banks take a more accommodative stance. Indeed, Sabrient’s SectorCast ETF rankings show high scores for some international-focused ETFs (as discussed later in this post).

While stocks rallied in 2023 (and bonds made a late-year comeback) mainly due to speculation on a Fed pivot toward lower interest rates (which supports valuations), for 2024 investors will want to see more in the way of actual earnings growth and other positive developments for the economy. I expect something of a “normalization” away from extreme valuation differentials and continued improvement in market breadth, whether it’s outperformance by last year’s laggards or a stagnation/pullback among last year’s biggest winners (especially if there are fewer rate cuts than anticipated)—or perhaps a bit of both. Notably, the S&P 500 historically has risen 20 of the last 24 election years (83%); however, a recent Investopedia poll shows that the November election is the biggest worry among investors right now, so it’s possible all the chaos, wailing and gnashing of teeth about Trump’s candidacy will make this election year unique with respect to stocks.

Regardless, I continue to believe that investors will be better served this year by active strategies that can identify and exploit performance dispersion among stocks across the capitalization spectrum—particularly smaller caps and the underappreciated, high-quality/low-valuation growers. Small caps tend to carry debt and be more sensitive to interest rates, so they have the potential to outperform when interest rates fall, but you should focus on stocks with an all-weather product line, a robust growth forecast, a solid balance sheet, and customer loyalty, which makes them more likely to withstand market volatility—which may well include those must-have, AI-oriented Tech stocks. Much like the impact of the Internet in the 1990s, AI/ML, blockchain/distributed ledger technologies (DLTs), and quantum computing appear to be the “it” technologies of the 2020’s that make productivity and efficiency soar. However, as I discuss in today’s post, the power requirements will be immense and rise exponentially. So, perhaps this will add urgency to what might become the technology of the 2030’s—i.e., nuclear fusion.

On that note, let me remind you that Sabrient’s actively selected portfolios include the Baker’s Dozen (a concentrated 13-stock portfolio offering the potential for significant outperformance), Small Cap Growth (an alpha-seeking alternative to a passive index like the Russell 2000), and Dividend (a growth plus income strategy paying a 4.5% current yield).

By the way, several revealing economic reports were released last week, which I discuss in today’s post. One was the December reading on the underappreciated New York Federal Reserve Global Supply Chain Pressure Index (GSCPI), which has fallen precipitously from it pandemic-era high and now is fluctuating around the zero line. This historically suggests falling inflation readings ahead. As for the persistently inverted yield curve, I continue to believe it has more to do with the unprecedented supply chain shocks coupled with massive fiscal and monetary stimulus to maintain demand and the resulting surge in inflation, which as observed by Alpine Macro, “makes the inversion more reflective of different inflation expectations than a signal for an impending recession.”

Also, although M2 money supply fell -4.6% from its all-time high in July 2022 until its low in April 2023, it has essentially flatlined since then and in fact has been largely offset to a great extent by an increase in the velocity of money supply. Also, we have a robust jobs market that has slowed but is far from faltering. And then there is the yield curve inversion that has been gradually flattening from a low of about -108 bps last July to -35 bps today.

I discuss all of this in greater detail in today’s post, including several illustrative tables and charts. I also discuss Sabrient’s latest fundamentals based SectorCast quantitative rankings of the ten U.S. business sectors (which is topped by Technology), current positioning of our sector rotation model (which turned bullish in early November and remains so), and some actionable ETF trading ideas.

Overall, I expect inflation will resume its decline, even with positive GDP growth, particularly given stagnant money supply growth, mending and diversifying supply chains (encompassing manufacturing, transportation, logistics, energy, and labor), falling or stabilizing home sale prices and new leases, slowing wage inflation, slower consumer spending on both goods and services, and a strong deflationary impulse from China due to its economic malaise and “dumping” of consumer goods to shore up its manufacturing (US imports from China were down 25% in 2023 vs. 2022). This eventually will give the Fed (and indeed, other central banks) license to begin cutting rates—likely by mid-year, both to head off renewed crises in banking and housing and to mitigate growing strains on highly leveraged businesses, consumers, government, and trading partners. Current CBOE fed funds futures suggest a 98% chance of at least 100 bps in rate cuts by year end (target rate of 4.25-4.50%), and 54% chance of at least 150 bps.

Click here to continue reading my full commentary … or if you prefer, here is a link to this post in printable PDF format (as some of my readers have requested). And please feel free to share my full post with your friends, colleagues, and clients! You also can sign up for email delivery of this periodic newsletter at Sabrient.com

Scott Martindale  by Scott Martindale
  President & CEO, Sabrient Systems LLC

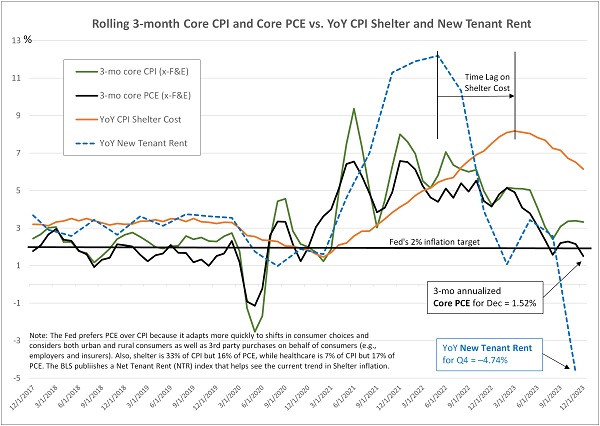
The New York Fed’s Global Supply Chain Pressure Index (GSCPI) for November was released today, and although it rose more than expected (likely due to disruptions from heightened global hostilities), it still suggests inflation will continue its gradual retreat, with a reading near the long-run average. But let me start by talking about October’s inflation indicators. Last week, the headline reading for Personal Consumption Expenditures (PCE) for October came in at 3.0% YoY, helped quite a bit by the fall in oil and gasoline prices (note: the US is producing an all-time high of 13.2 million barrels/day of crude oil). Core PCE, which is the Federal Reserve's preferred inflation metric, came in at 3.46% year-over-year. However, the month-over-month number for October versus September, which better reflects today's inflation trends and the lag effects of higher interest rates, came in at 0.16%, which annualizes to 1.98%. Keep in mind, the Fed's inflation target is 2.0%. But monthly data can be choppy, so looking at the rolling 3-month average, it annualizes to 2.37%.

Earlier reports had shown October PPI at 1.3% YoY and CPI at 3.2%, with core PPI (excluding food & energy) was 2.4% YoY, and core CPI was 4.0%. All of this was presaged by the GSCPI, which measures the number of standard deviations from the historical average value (aka Z-score) and generally foreshadows movements in inflation metrics. It plummeted from a December 2021 all-time high of +4.31 down to the October reading of -1.74—its lowest level ever. However, that ultra-low October reading has been revised to -0.39 due to “a change in exchange rate weighting methodology,” according to the New York Fed. Nevertheless, the writing was on the wall for last week’s favorable PCE report. The chart below illustrates the correlation between GSCPI, PPI, and CPI.

GSCPI vs CPI and PPI

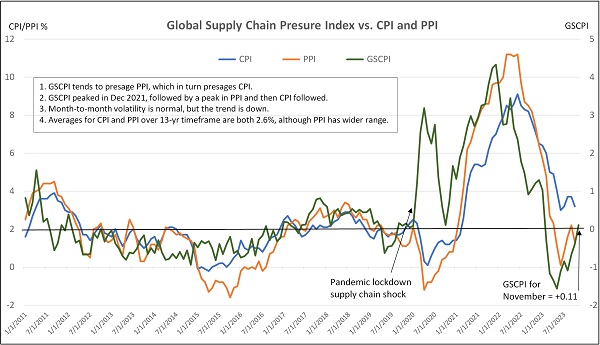
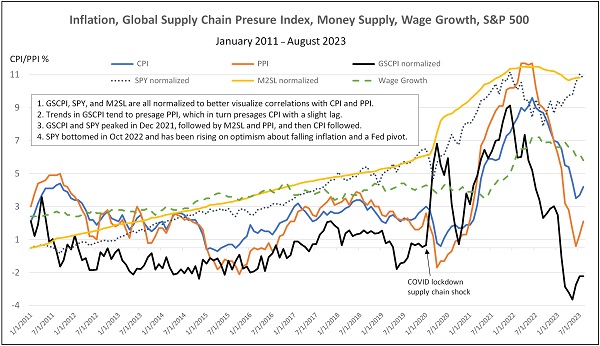
So, what to expect for November inflation? Well, as shown in the chart, GSCPI for November just came in today at 0.11. Although rising from its ultra-low levels, it still remains at the long-run average, and the chart illustrates that volatility is to be expected. All in all, I think it still bodes well for the next week’s CPI/PPI readings as supply chains continue to heal and diversify (albeit with occasional hiccups like we see today from heightened global hostilities), especially when you also consider that the consumer has become stretched with rising household debt and falling growth in job openings and wages, money supply growth is stagnant, and budget hawks are increasingly flexing their fiscal muscles in Congress. Thus, I believe the probability of a resurgence in either inflation or fiscal expansion is quite low.

Furthermore, although the second estimate for Q3 GDP was ultra-strong (the highest in 2 years), revised up to 5.2% annual rate (from previous 4.9%), the boost came from state and federal government spending, which was revised up to 5.5% from the prior estimate of 4.6% (i.e., more unsustainable deficit spending and issuance of Treasuries paying high coupons, mostly from an 8.2% increase in defense spending), while personal consumption was revised down to 3.6% from 4.0%. This tells me the “robust” GDP number was something of an illusion.

Indeed, looking ahead, the Atlanta Fed’s GDPNow forecasts only 1.3% GDP growth and 1.9% PCE growth for Q4 (as of 12/6). Moreover, the good folks at Real Investment Advice observed that Gross Domestic Income (GDI) for Q3 was reported at only +1.5%, displaying the widest gap below GDP in 50 years. (Note: GDP measures the value of goods and services produced, including consumption expenditures, investments and exports, while GDI measures incomes earned and costs incurred in production of GDP, including wages, profits, and taxes.) Also, last week’s Fed Beige Book showed that two-thirds of Fed districts reported slower economic activity over the prior six weeks, and the ISM Manufacturing Index came in at an anemic 46.7, showing continued contraction for the 15th straight month.

So, this all seems to be more “bad news is good news” when it comes to Fed policy moves, and investors will be eagerly watching Friday’s jobs report followed by next week’s CPI, PPI, and FOMC policy announcement. Stocks have been taking a healthy breather and consolidation in anticipation of it all, but so far, no major pullback. This year seems to be following the playbook of what economist Ed Yardeni has characterized as a series of “rolling recessions” (among sectors) and an “Immaculate Disinflation,” i.e., moderating inflation without a harsh recession or massive layoffs. As an aside, I have opined many times that it is ridiculous that we constantly find ourselves awaiting the edict of this unelected board of “wise elders” to decide our economic fate. Why can’t they take emergency measures only when absolutely necessary to avert economic cataclysm, and then once the crisis has passed, those emergency measures are quickly withdrawn so that the free market can get back to doing its productive, creative, wonderful thing? One can dream.

Regardless, in my view, the Fed is likely done with rate hikes and preparing for its eventual pivot to rate cuts—which I think will come sooner than most expect, likely before the end of H1 2024. Why? Because if inflation maintains its gradual downtrend while the Fed holds its overnight borrowing rate steady, the real (inflation-adjusted) rate keeps rising, i.e., de facto tightening. Indeed, Fed funds futures are projecting 98% chance for no rate change next week, and for 2024, 62% chance for at least one 25-bp rate cut by March, 97% for at least one 25-bp cut by June, and 89% chance of a full 1.0% in total rate cuts by December 2024, which would put the fed funds rate below 4.5%.

Accordingly, after kissing the 5% handle, the 10-year Treasury yield has fallen precipitously to below 4.2%—a level last seen at the end of August. So, I encourage and expect the FOMC to follow the message of the bond market and begin cutting the fed funds rate back towards the neutral rate, which I think is around 2.5-3.0% nominal (i.e., 2% target inflation plus 0.5-1.0% r-star), and hand back control of the economy to the free market. As of now, the Fed is on the verge of crushing the housing market…and by extension the broader economy. In addition, it must ensure money supply resumes a modest growth rate (albeit slowly), not continue to shrink or stagnate.

To be sure, the safe steadiness of bond yields was disrupted this year. After rising much faster than anyone anticipated, interest rates have fallen much faster than expected, especially considering that the Fed hasn’t made any dovish policy changes. Nevertheless, if rates are going to generally meander lower, investors might be expected to lock in sustainable yield with capital appreciation potential through longer-duration securities, including long-term bonds, “bond proxies” like dividend-paying equities (e.g., utilities, staples, and REITs), and growth stocks (like high-quality technology companies).

I also like oil, gold and uranium stocks, as well as gold, silver, and cryptocurrency as stores of value in an uncertain macro climate. Notably, gold is challenging its highs of the past few years as global investors and central banks are both hedging and/or speculating on a weaker dollar, falling real interest rates, rising geopolitical tensions, and potential financial crisis, and the World Gold Council reported robust demand among central banks, which purchased a record 800 tons during the first three quarters of the year. Similarly, Bitcoin is catching a bid on speculation of broader investor access (through spot-price ETFs) and dollar debasement (if debt and deficit spending continue to spiral).

Keep in mind that, when valuations get lofty within a given asset class, volatility and performance/valuation dispersion among stocks often increases while correlations decrease. For stocks, active selection strategies that can exploit the dispersion to identify under-the-radar and undervalued companies primed for explosive growth become more appealing versus passive index investing. Sabrient’s actively selected portfolios include the Q4 2023 Baker’s Dozen (launched on 10/20), Small Cap Growth 40 (launched on 11/3), and Sabrient Dividend 46 (just launched on 11/29, and today offers a 4.7% dividend yield).

In today’s post, I further discuss inflation, the US dollar, Fed monetary policy implications, and relative performance of asset classes. I also discuss Sabrient’s latest fundamentals based SectorCast quantitative rankings of the ten U.S. business sectors (which is topped by Technology and Industrials), current positioning of our sector rotation model (which turned bullish in early November and remains so), and some actionable ETF trading ideas.

Click here to continue reading my full commentary … or if you prefer, here is a link to this post in printable PDF format (as some of my readers have requested).

Scott Martindale  by Scott Martindale
  President & CEO, Sabrient Systems LLC

As expected, last week the FOMC left the fed funds rate as is at 5.25-5.50%. Fed funds futures suggest the odds of a hike at the December meeting have fallen to less than 10%, and the odds of at least three 25-bp rate cuts by the end of 2024 have risen to nearly 80%, with a 25% chance the first cut comes as soon as March. As a result, after moving rapidly to cash for the past few months, stock and bond investors came rushing back with a vengeance. But what really goosed the market were underwhelming economic reports leading to Fed Chair Jerome Powell’s comments suggesting the lag effects on surging interest rates and the strong US dollar are finally manifesting. Investors apparently believed the Fed’s promise of “higher for longer” (making the Fed’s job easier), which spiked Treasury yields (and by extension, mortgage rates) much faster and more severely than the Fed intended.

The S&P 500 had fallen well below all major moving averages, accelerating downward into correction territory, and was down 10% from its 7/31 high. Moreover, the S&P 500 Bullish Percent Index (BPSPX), which rarely drops below 25, had fallen to a highly oversold 23 (anything below 30 is considered oversold), and the CBOE Volatility Index (VIX) had surged above the 20 “panic threshold” to hit 23. Both were contrarian bullish signals. Then stocks began to recover ahead of the FOMC meeting, and after the less-than-hawkish policy announcement, it triggered short covering and an options-driven “gamma squeeze,” with the S&P 500 surging above its 200-day, 50-day, and 20-day moving averages (leaving only the 100-day still above as potential resistance), the BPSPX bullish percent closed the week at 43 (which is still well below the overbought level of 80 last hit on 7/31), and the VIX closed the week below 15.

The recovery rally was broad, and in five short days put the major indexes back to where they were two weeks ago. The best performers were those that sold off the most, essentially erasing the late-October swoon in any instant. As for Treasury yields, the week ended with the 2-year at 4.84% (after hitting 5.24% in mid-October) and the 10-year at 4.57% (after touching 5.0% in mid-October), putting the 2-10 inversion at -27 bps. The 30-year mortgage rate has fallen back below 7.50%. Recall that my “line in the sand” for stocks has been the 2-year staying below 5.0%, and indeed falling below that level last week correlated with the surge in equities.

Looking ahead, investors will be wondering whether last week’s huge relief rally is sustainable, i.e., the start of the much-anticipated Q4 rally. After all, it is well known that some of the most startling bull surges happen during bear markets. Regardless, stock prices are ultimately based on earnings and interest rates, and earnings look quite healthy while interest rates may have topped out, as sentiment indicators are flashing contrarian buy signals (from ultra-low levels). But much still hinges on the Fed, which is taking its cues from inflation and jobs reports. Last week’s FOMC statement suggests a lessening of its hawkishness, but what if the Fed has viewed our post-pandemic, return-to-normalcy, sticky-inflation economic situation—and the need for harsh monetary intervention—all wrong?

Much of the empirical data shows that inflation was already set to moderate without Fed intervention, given: 1) post-lockdown recovery in supply chains, rising labor force participation, and falling excess savings (e.g., the end to relief payments and student debt forbearance); and 2) stabilization/contraction in money supply growth. These dynamics alone inevitably lead to consumer belt-tightening and slower economic growth, not to mention the resumption in the disinflationary secular trends and the growing deflationary impulse from a struggling China.

Notably, the New York Fed’s Global Supply Chain Pressure Index (GSCPI), which measures the number of standard deviations from the historical average value (aka Z-score) and generally presages movements in PPI (and by extension, CPI), was released earlier today for October, and it plummeted to -1.74, which is its lowest level ever. This bodes well for CPI/PPI readings next week and PCE at month end, with a likely resumption in their downtrends. So, although the Fed insists the economy and jobs are strong and resilient so it can focus on taming the scourge of inflation through “higher for longer” interest rates, I remain less concerned about inflation than whether the Fed will pivot quickly enough to avoid inducing an unnecessary recession.

Assuming the Fed follows through on its softer tone and real yields continue to fall (and we manage to avoid World War III), I think this latest rally has given investors renewed legs—likely after a profit-taking pullback from last week’s 5-day moonshot. With over 80% of the S&P 500 having reported, Q3 earnings are handily exceeding EPS expectations (3.7% YoY growth, according to FactSet, driven mostly by a robust profit margin of 12.1%), and optimistic forecasts for 2024-2025 earnings growth are holding up. Meanwhile, a renewed appetite for bonds promises to drive down interest rates.

I like the prospects for high-quality/low-debt technology companies, bonds and bond-proxies (e.g., utilities and consumer staples), oil and uranium stocks, gold miners, and bitcoin in this macro climate. Furthermore, we continue to believe that, rather than the broad-market, passive indexes that display high valuations, investors may be better served by active stock selection Sabrient’s portfolios include the new Q4 2023 Baker’s Dozen (launched on 10/20), Small Cap Growth 40 (just launched on 11/3), and Sabrient Dividend 45 (launched on 9/1, and today offers a 5.5% dividend yield).

In today’s post, I discuss the trend in supply chains and inflation, equity valuations, and Fed monetary policy implications. I also discuss Sabrient’s latest fundamentals based SectorCast quantitative rankings of the ten U.S. business sectors (which is topped by Technology and Industrials), current positioning of our sector rotation model (which is switching from neutral to a bullish bias, assuming support at the 50-day moving average holds for the S&P 500), and some actionable ETF trading ideas.

Click here to continue reading my full commentary … or if you prefer, here is a link to this post in printable PDF format (as some of my readers have requested).

Scott Martindale  by Scott Martindale
  President & CEO, Sabrient Systems LLC

Federal shutdown averted, at least for another 6 weeks, which may give investors some optimism that cooler heads will prevail in the nasty tug-of-war between the budget hawks and the spendthrifts on the right and left flanks. Nevertheless, I think stocks still may endure some turmoil over the next few weeks before the historically bullish Q4 seasonality kicks in—because, yes, there are still plenty of tailwinds.

From a technical standpoint, at the depths of the September selloff, 85% of stocks were trading below their 50-day moving averages, which is quite rare, and extreme September weakness typically leads to a strong Q4 rally. And from a fundamental standpoint, corporate earnings expectations are looking good for the upcoming Q3 reporting season and beyond, as analysts are calling for earnings growth of 12.2% in 2024 versus 2023, according to FactSet. But that still leaves us with the interest rate problem—for the economy and federal debt, as well as valuation multiples (e.g., P/E) and the equity risk premium—given that my “line in the sand” for the 2-year Treasury yield at the 5% handle has been solidly breached.

But the good news is, we learned last week that the Fed’s preferred inflation metric, core PCE (ex-food & energy), showed its headline year-over-year (YoY) reading fall to 3.9% in August (from 4.3% in July). And more importantly in my view, it showed a month-over-month (MoM) reading of only 0.14%, which is a better indicator of the current trend in consumer prices (rather than comparing to prices 12 months ago), which annualizes to 1.75%—which of course is well below the Fed’s 2% inflation target. Even if we smooth the last 3 MoM reports for core PCE of 0.17% in June, 0.22% in July, and 0.14% in August, the rolling 3-month average annualizes to 2.16%. Either way, it stands in stark contrast to the upward reversal in CPI that previously sent the FOMC and stock and bond investors into a tizzy.

Notably, US home sales have retreated shelter costs have slowed, wage inflation is dropping, and China is unleashing a deflationary impulse by dumping consumer goods and parts on the global market in a fit of desperation to maintain some semblance of GDP growth while its critical real estate market teeters on the verge of implosion.

So, core inflation is in a downtrend while nominal interest rates are rising, which is rapidly driving up real rates, excessively strengthening the dollar, threatening our economy, and contributing to distress among our trading partners and emerging markets—including capital flight, destabilization, and economic migration. Also, First Trust is projecting interest on federal debt to hit 2.5% of GDP by year-end, up sharply from 1.85% last year (which was the highest since 2001 during a steep decline from its 1991 peak of 3.16%).

Therefore, I believe the Fed is going to have to lighten up soon on hawkish rate policy and stagnant/falling money supply. When the Fed decides it’s time to cut rates—both to head off escalating crises in banking and housing and to mitigate growing strains on highly leveraged businesses, consumers, and foreign countries (from an ultra-strong dollar and high interest rates when rolling maturing debt)—it would be expected to ignite a sustained rally in both stocks and bonds.

But even if the AI-leading, Big Tech titans can justify their elevated valuations with extraordinary growth—and according to The Market Ear, they trade at the largest discount to the median stock in the S&P 500 stock in over 6 years on a growth-adjusted basis—investors still may be better served by active strategies that exploit improving market breadth by seeking “under the radar” opportunities poised for explosive growth, rather than the broad passive indexes. So, we believe this is a good time to be invested in Sabrient’s portfolios—including the new Q3 2023 Baker’s Dozen (launched on 7/20), Forward Looking Value 11 (launched on 7/24), Small Cap Growth 39 (launched on 8/7), and Sabrient Dividend 45 (launched on 9/1 and today offers a 5.5% dividend yield).

In today’s post, I discuss inflation, stock-bond relative performance, equity valuations, and Fed monetary policy implications. I also discuss Sabrient’s latest fundamentals based SectorCast quantitative rankings of the ten U.S. business sectors (which continues to be topped by Technology and Energy), current positioning of our sector rotation model (neutral bias), and some actionable ETF trading ideas. Your feedback is always welcome!

Click here to continue reading my full commentary … or if you prefer, here is a link to this post in printable PDF format (as some of my readers have requested).

Scott Martindale  by Scott Martindale
  President & CEO, Sabrient Systems LLC

Given the latest inflation reports last week and this week’s FOMC meeting, I thought I would offer up some perspective today in a short post. Although there are plenty of other issues to worry about, including the historic auto workers’ strike and an impending federal government shutdown, all eyes are focused on the Fed’s reaction to inflation and jobs reports in the form of monetary policy, specifically interest rates and money supply.

The 2-year yield again has been battling the important 5% threshold, which I have called a “line in the sand” for stocks. After challenging the March and July highs above 5% during August, it had appeared to me that it was just another buyable bond selloff, driven by the various reasons I discussed in my 9/1/2023 post. Indeed, yields pulled back substantially to end the month of August, as both bond and stock prices rose. But this month’s renewed weakness in bonds (and the rise in yields) suggests a “buyer’s strike” as investors generally have been moving to cash ahead of this week’s FOMC meeting. At the moment, resistance at the 5-handle seems to have given way, with the rate now at 5.10% as I write (and stocks are weak).

To be sure, last week’s inflation reports gave mixed signals. CPI and PPI both ticked up from their June lows of 3.0% and 0.1%, respectively, to August readings of 3.7% and 1.6%, which appear troubling to the Fed’s ongoing inflation fight. Certainly, the recent surge in oil prices to above $90 has hurt the cause, as has the stubborn shelter cost component, which makes up 42% of CPI. In addition, Mexico’s rise as a “near-shore” manufacturing hub for the US, its extreme wage inflation, and the extraordinary strength of the peso has increased prices of its exports to the US.

On the other hand, rising oil prices are like a tax on consumers, limiting their disposable income to buy other things. Same with the imminent student loan payment restart. Also, core rates (ex-food and energy) for CPI and PPI both fell to 4.3% and 2.2%, respectively. And given the emerging “lag effects” of rising interest rates on rents and owner’s equivalent rent (OER), many economists expect shelter costs to begin to decline very soon. Indeed, by Q4 2024, JPMorgan chief global strategist David Kelly expects both headline and core PCE to fall below the Fed’s 2% target and perhaps hit 1.5%, largely driven by declines in shelter costs, new and used car prices, auto insurance, and car maintenance. 

Below is an updated version of a chart I present from time to time. It compares trends in CPI and PPI versus the New York Fed’s Global Supply Chain Pressure Index (GSCPI), which measures the number of standard deviations from the historical average value. It also shows wage growth, M2 money supply (M2SL), and the S&P 500 (SPY). I know the chart is busy, but it tells a good story.

Inflation, Supply Chains, and S&P 500

Read on....

Scott Martindale  by Scott Martindale
  President & CEO, Sabrient Systems LLC

Stocks and bonds both sold off in August before finishing the month with a flourish, as signs that the jobs market is weakening suggest an end to Fed rate hikes is nigh. The summer correction in equities was entirely expected after the market’s extraordinary display of strength for the first seven months of the year in the face of a relentlessly hawkish Federal Reserve, even as CPI and PPI have fallen precipitously. State Street’s Institutional Investor Risk Appetite Indicator moved dramatically from bearish in May to highly bullish at the end of July, and technical conditions were overbought. And although the depth of the correction took the bulls by surprise, it was quite orderly with the CBOE Volatility Index (VIX) staying tame (i.e., never even approaching the 20 handle). In fact, a 5% pullback in the S&P 500 is not unusual given the robust 20% YTD return it had attained in those seven months. Weakness in bonds, gold, and commodity prices also reversed.

Moreover, IG, BBB, and HY bond spreads have barely moved during this market pullback despite rising real rates, which signals that the correction in stocks is more about valuations in the face of the sudden spike in interest rates (and fears of “higher for longer”) rather than the health of the economy, earnings, or fundamentals. Certainly, the US economy looks much stronger than any of our trading partners (which Fed chair Powell seems none too happy about), with the Atlanta Fed’s GDPNow model estimating a robust 5.6% growth for Q3 (as of 8/31) and the dollar surging in a flight to safety [in fact, the US Dollar Index Fund (UUP) recently hit a 2023 high].

However, keep in mind that the US is not an island unto itself but part of a complex global economy and thus not immune to contagion, so the GDP growth rate will likely come down. Moreover, Powell said in his Jackson Hole speech that the Fed’s job is “complicated by uncertainty about the duration of the lags with which monetary tightening affects economic activity and especially inflation.”

Investors have generally retained their enthusiasm about stocks despite elevated valuations, rising real interest rates (creating a long-lost viable alternative to stocks—and a poor climate for gold), a miniscule equity risk premium, and a Fed seemingly hell-bent on inducing recession in order to crush sticky core inflation. Perhaps stock investors have been emboldened by the unstoppable secular force of artificial intelligence (AI) and its immediate benefits to productivity and profitability (not just “hope”)—as evidenced by Nvidia’s (NVDA) incredible earnings release last week.

I have discussed in recent posts about how the Bull case seems to outweigh the (highly credible) Bear case. However, the key tenets of the Bull case—and avoidance of recession—include a stable China. Since 2015, I have been talking about a key risk to the global economy being the so-called “China Miracle” gradually being exposed as a House of Cards, and perhaps never before has it seemed so close to implosion, as it tests the limits of debt-fueled growth—and a creeping desperation coupled with an inability (or unwillingness) to pivot sharply from its longstanding policies makes it even more dangerous. I talk more about this in today’s post.

Yet despite all the significant challenges and uncertainties, I still believe stocks are in a normal/predictable summer consolidation—particularly after this year’s surprisingly strong market performance through July—with more upside to come. My only caveat has been that the 2-year Treasury yield needs to remain below 5%—a critical “line in the sand,” so to speak. Although I (and many others) often cite the 10-year yield because of its link to mortgage rates, I think the 2-year is important because it reflects a broad expectation of inflation and the duration of the Fed’s “higher for longer” policy. Notably, during this latest spike in rates, the 2-year again eclipsed that critical 5-handle for the third time this year and challenged the 7/5 intraday high of 5.12%, before pulling back sharply to close the month below 4.9%.

If the 2-year reverses again and surges to new highs, I think it threatens a greater impact on our economy (as well as our trading partners’) as businesses, consumers, and governments manage their maturing lower-rate debt—and ultimately impacts the housing market and risk assets, like stocks. But instead, I see it as just another short-term rate spike like we saw in March and July, as investors sort out the issues described in my full post below. Indeed, August finished with a big fall in rates in concert with a big jump in stocks, gold, crypto, and other risk assets across the board, as cracks in the jobs and housing markets are showing up, leading to a growing belief that the Fed is finished with its rate hikes—as I think they should be, particularly given the resumption of disinflationary secular trends and a deflationary impulse from China.

Some economists believe that extreme stock valuations and the ultra-low equity risk premium are pricing in both rising earnings and falling rates—an unlikely duo, in their view, on the belief that a strong economy is inherently inflationary while a weakening economy suggests lower earnings—and thus, recession is inevitable. But I disagree. For one, respected economist Ed Yardeni has observed that we have already been in the midst of a “rolling recession” across segments of the economy that is now turning into a “rolling expansion.” And regarding elevated valuations in the major indexes, my observation is that they are primarily driven by a handful of mega-cap Tech names. Minus those, valuations across the broader market are much more reasonable, as I discuss in today’s post.

Indeed, rather than passive positions in the broad market indexes, investors may be better served by strategies that seek to exploit improving market breadth and the performance dispersion among individual stocks. Sabrient’s portfolios include Baker’s Dozen, Forward Looking Value, Small Cap Growth, and Dividend, each of which provides exposure to market segments and individual companies that our models suggest may outperform. Let me know how I can better serve your needs, including speaking at your events (whether by video or in person).

As stocks and other risk assets finish what was once destined to be a dismal month with a show of renewed bullish conviction, allow me to step through in greater detail some of the key variables that will impact the market through year-end and beyond, including the economy, valuations, inflation, Fed policy, the dollar, and China…and why I remain bullish. I also review Sabrient’s latest fundamentals based SectorCast quant rankings of the ten U.S. business sectors (topped by Technology and Energy) and serve up some actionable ETF trading ideas.

Click here to continue reading my full commentary … or if you prefer, here is a link to my full post in printable PDF format (as some of my readers have requested).

Scott Martindale  by Scott Martindale
  President & CEO, Sabrient Systems LLC

Stocks continued their impressive 2023 rally through July, buoyed by rapidly falling inflation, steady GDP and earnings growth, improving consumer and investor sentiment, and a fear of missing out (FOMO). Of course, the big story this year has been the frenzy around the promise of artificial intelligence (AI) and leadership from the “Magnificent Seven” Tech-oriented mega caps—Apple (AAPL), Amazon (AMZN), Alphabet (GOOGL), NVIDIA (NVDA), Meta (META), Tesla (TSLA), and Microsoft (MSFT), which have led the powerhouse Nasdaq 100 (QQQ) to a +44.5% YTD return (as of 7/31) and within 5% of its all-time closing high of $404 from 11/19/2021. Such as been the outperformance of these 7 stocks that Nasdaq chose to perform a special re-balancing to bring down their combined weighting in the Nasdaq 100 index from 55% to 43%!

Because the Tech-heavy Nasdaq badly underperformed during 2022, mostly due to the long-duration nature of aggressive growth stocks in the face of a rising interest rate environment, it was natural that it would lead the rally, particularly given: 1) falling inflation and an expected Fed pause/pivot on rate hikes, 2) resilience in the US economy, corporate profit margins (largely due to cost discipline), and the earnings outlook; 3) the exciting promise of disruptive/transformational technologies like regenerative artificial intelligence (AI), blockchain and distributed ledger technologies (DLTs), and quantum computing.

But narrow leadership isn’t healthy—in fact, it reflects defensive sentiment, as investors prefer to stick with the juggernauts rather than the vast sea of economically sensitive companies. However, since June 1, there have been clear signs of improving market breadth, with the iShares Russell 2000 small caps (IWM), S&P 400 mid-caps (MDY), and S&P 500 Equal Weight (RSP) all outperforming the QQQ and S&P 500 (SPY). Industrial commodities oil, silver, and copper prices rose in July. This all bodes well for market health through the second half of the year (and perhaps beyond), as I discuss in today’s post below.

But for the moment, an overbought stock market is taking a breather to consolidate gains, take some profits, and pull back. The Fitch downgrade of US debt is helping fuel the selloff. I view it as a welcome buying opportunity.

Although rates remain elevated, they haven’t reached crippling levels (yet), and although M2 money supply has topped out and fallen a bit, the decline has been offset by a surge in the velocity of money supply, as I discuss in today’s post. So, assuming the Fed is done raising rates—and I for one believe the fed funds rate is already beyond the neutral rate (and thus contractionary)—and as long as the 2-year Treasury yield remains below 5% (it’s around 4.9% today), I think the economy and stocks will be fine, and the extreme yield inversion will begin to reverse.

The Fed’s dilemma is to facilitate the continued process of disinflation without inducing deflation, which is recessionary. Looking ahead, Nick Colas at DataTrek recently highlighted the disconnect between fed funds futures (which are pricing in 1.0-1.5% in rate cuts early next year) and US Treasuries (which do not suggest imminent rate cuts). He believes, “Treasuries have it right, and that’s actually bullish for stocks” (bullish because rate cuts only become necessary when the economy falters).

So, today we see inflation has fallen precipitously as supply chains improve (manufacturing, transport, logistics, energy, labor), profit margins are beating expectations (largely driven by cost discipline), corporate earnings have been resilient, earnings forecasts are seeing upward revisions, capex and particularly construction spending on manufacturing facilities has been surging, hiring remains robust (almost 2 job openings for every willing worker), the yield curve inversion is trying to flatten, gold and high yield spreads have been falling since May 1 (due to recession risk receding, the dollar firming, and real yields rising), risk appetite (“animal spirits”) is rising, and stock market leadership is broadening. It all sounds promising to me.

Regardless, the passive broad-market mega-cap-dominated indexes that were so hard for active managers to beat in the past may well face tough constraints on performance, particularly in the face of elevated valuations (i.e., already “priced for perfection”), slow real GDP growth, and an ultra-low equity risk premium. Thus, investors may be better served by strategic-beta and active strategies that can exploit the performance dispersion among individual stocks, which should be favorable for Sabrient’s portfolios including Baker’s Dozen, Forward Looking Value, Small Cap Growth, and Dividend.

As a reminder, Sabrient’s enhanced Growth at a Reasonable Price (GARP) “quantamental” selection process strives to create all-weather growth portfolios, with diversified exposure to value, quality, and growth factors, while providing exposure to both longer-term secular growth trends and shorter-term cyclical growth and value-based opportunities—with the potential for significant outperformance versus market benchmarks. Indeed, the Q2 2022 Baker’s Dozen that recently terminated on 7/20 handily beat the benchmark S&P 500, +28.3% versus +3.8% gross total returns. In addition, each of our other next-to-terminate portfolios are also outperforming their relevant market benchmarks (as of 7/31), including Small Cap Growth 34 (16.9% vs. 9.9% for IWM), Dividend 37 (24.0% vs. 8.5% for SPYD), Forward Looking Value 10 (38.9% vs. 20.8% for SPY), and Q3 2022 Baker’s Dozen (28.4% vs. 17.9% for SPY).

Also, please check out Sabrient’s simple new stock and ETF screening/scoring tools called SmartSheets, which are available for free download for a limited time. SmartSheets comprise two simple downloadable spreadsheets—one displays 9 of our proprietary quant scores for stocks, and the other displays 3 of our proprietary scores for ETFs. Each is posted weekly with the latest scores. For example, Lantheus Holdings (LNTH) was ranked our #1 GARP stock at the beginning of February. Accenture (ACN) was at the top for March, Kinsdale Capital (KNSL) in April, Crowdstrike (CRWD) in May, and at the start of both June and July, it was discount retailer TJX Companies (TJX). Each of these stocks surged higher (and outperformed the S&P 500)—over the ensuing weeks after being ranked on top. We invite you to download the latest weekly sheets for stocks and ETFs using the link above—it’s free of charge for now. And please send me your feedback!

Here is a link to my full post in printable format. In this periodic update, I provide a comprehensive market commentary, including discussion of inflation, money supply, and why the Fed should be done raising rates; as well as stock valuations and opportunities going forward. I also review Sabrient’s latest fundamentals based SectorCast quant rankings of the ten U.S. business sectors and serve up some actionable ETF trading ideas. Read on…

Scott Martindale  by Scott Martindale
  President & CEO, Sabrient Systems LLC

After five straight weeks of gains—goosed by a sudden surge in excitement around the rapid advances, huge capex expectations, and promise of Artificial Intelligence (AI), and supported by the CBOE Volatility Index (VIX) falling to its lowest levels since early 2020 (pre-pandemic)—it was inevitable that stocks would eventually take a breather. Besides the AI frenzy, market strength also has been driven by a combination of “climbing a Wall of Worry,” falling inflation, optimism about a continued Fed pause or dovish pivot, and the proverbial fear of missing out (aka FOMO).

Once a debt ceiling deal was struck at the end of May, a sudden jump in sentiment among consumers, investors, and momentum-oriented “quants” sent the mega-cap-dominated, broad-market indexes to new 52-week highs. Moreover, the June rally broadened beyond the AI-oriented Tech giants, which is a healthy sign. AAIA sentiment moved quickly from fearful to solidly bullish (45%, the highest since 11/11/2021), and investment managers are increasing equity exposure, even before the FOMC skipped a rate hike at its June meeting. Other positive signs include $7 trillion in money market funds that could provide a sea of liquidity into stocks (despite M2 money supply falling), the US economy still forecasted to be in growth mode (albeit slowly), corporate profit margins beating expectations (largely driven by cost discipline), and improvements in economic data, supply chains, and the corporate earnings outlook.

Although the small and mid-cap benchmarks joined the surge in early June, partly boosted by the Russell Index realignment, they are still lagging quite significantly year-to-date while reflecting much more attractive valuations, which suggests they may provide leadership—and more upside potential—in a broad-based rally. Regardless, the S&P 500 has risen +20% from its lows, which market technicians say virtually always indicates a new bull market has begun. Of course, the Tech-heavy Nasdaq badly underperformed during 2022, mostly due to the long-duration nature of growth stocks in the face of a rising interest rate environment, so it is no surprise that it has greatly outperformed on expectations of a Fed pause/pivot.

With improving market breadth, Sabrient’s portfolios—which employ a value-biased Growth at a Reasonable Price (GARP) style and hold a balance between cyclical sectors and secular-growth Tech and across market caps—this month have displayed some of their best-ever outperformance days versus the benchmark S&P 500.

Of course, much still rides on Fed policy decisions. Inflation continues its gradual retreat due to a combination of the Fed allowing money supply to fall nearly 5% from its pandemic-response high along with a huge recovery in supply chains. Nevertheless, the Fed has continued to exhibit a persistently hawkish tone intended to suppress an exuberant stock market “melt-up” and consumer spending surge (on optimism about inflation and a soft landing and the psychological “wealth effect”) that could hinder the inflation battle.

Falling M2 money supply has been gradually draining liquidity from the financial system (although the latest reading for May showed a slight uptick). And although fed funds futures show a 77% probably of a 25-bp hike at the July meeting, I’m not so sure that’s going to happen, as I discuss in today’s post. In fact, I believe the Fed should be done with rate hikes…and may soon reverse the downtrend in money supply, albeit at a measured pace. (In fact, the May reading for M2SL came in as I was writing this, and it indeed shows a slight uptick in money supply.) The second half of the year should continue to see improving market breadth, in my view, as capital flows into the stock market in general and high-quality names in particular, from across the cap spectrum, including the neglected cyclical sectors (like regional banks).

Regardless, the passive broad-market mega-cap-dominated indexes that were so hard for active managers to beat in the past may well face high-valuation constraints on performance, particularly in the face of slow real GDP growth (below inflation rate), sluggish corporate earnings growth, elevated valuations, and a low equity risk premium. Thus, investors may be better served by strategic-beta and active strategies that can exploit the performance dispersion among individual stocks, which should be favorable for Sabrient’s portfolios—including Q2 2023 Baker’s Dozen, Small Cap Growth 38, and Dividend 44—all of which combine value, quality, and growth factors while providing exposure to both longer-term secular growth trends and shorter-term cyclical growth and value-based opportunities. (Note that Dividend 44 offers both capital appreciation potential and a current yield of 5.1%.)

Quick reminder about Sabrient’s stock and ETF screening/scoring tool called SmartSheets, which is available for free download for a limited time. SmartSheets comprise two simple downloadable spreadsheets—one displays 9 of our proprietary quant scores for stocks, and the other displays 3 of our proprietary scores for ETFs. Each is posted weekly with the latest scores. For example, Lantheus Holdings (LNTH) was ranked our #1 GARP stock at the beginning of February before it knocked its earnings report out of the park on 2/23 and shot up over +20% in one day (and kept climbing). At the start of March, it was Accenture (ACN). At the beginning of April, it was Kinsdale Capital (KNSL). At the beginning of May, it was Crowdstrike (CRWD). At the start of June, it was again KNSL (after a technical pullback). All of these stocks surged higher—while significantly outperforming the S&P 500—over the ensuing weeks. Most recently, our top-ranked GARP stock has been discount retailer TJX Companies (TJX), which was up nicely last week while the market fell. Feel free to download the latest weekly sheets using the link above—free of charge for now—and please send us your feedback!

Here is a link to my full post in printable format. In this periodic update, I provide a comprehensive market commentary, including discussion of inflation and why the Fed should be done raising rates, stock valuations, and the Bull versus Bear cases. I also review Sabrient’s latest fundamentals based SectorCast quant rankings of the ten U.S. business sectors and serve up some actionable ETF trading ideas. Read on…

Scott Martindale  by Scott Martindale
  President & CEO, Sabrient Systems LLC

Federal Reserve chairman Jay Powell sounded quite hawkish at his brief Jackson Hole speech on Friday, and investors were spooked. But keep in mind, he will be reacting to the inflation data as it comes. And although the CPI hit 40-year high of 9.1% YoY in June, I see plenty of signs that inflation is in retreat. Many commentators have been attempting to predict the future of inflation and the economy by making comparisons with prior periods of high inflation. But what makes today’s situation unique is the impact of artificial supply chain disruption due to forced lockdowns rather than economic forces. Thus, I believe the Fed has been trying to “buy time” to allow supply chains to mend by using hawkish rhetoric and creating as much demand destruction as possible – without overtly crushing the economy into recession (a la Paul Volcker). Here are some of the signs that inflationary pressures are receding:

  1. CPI began to flatten out in July after 16 straight months of increases, coming in at 8.5% YoY (after topping out at 9.1% in June).
     
  2. Business inventories have risen sharply (according to the St. Louis Fed), which implies disinflationary pressure on finished goods, and the important inventory/sales ratio is making its way back to pre-pandemic levels. Wholesale prices and import prices both came in better than predicted, and commodity prices, shipping rates, and home prices are all either stabilizing or falling.
     
  3. The Fed’s preferred inflation gauge – Personal Consumption Expenditures (PCE) Index excluding food and energy – has slowed each month since its February peak, falling from 5.3% to 4.7%.
     
  4. July PPI data fell 0.5%, which was the first decline in producer prices since pre-pandemic. Historically, large moves to negative PPI readings like this have led to significantly lower inflation over subsequent months.
     
  5. The New York Fed’s Global Supply Chain Pressure Index (GSCPI) has been falling rapidly since the start of the year.
     
  6. The St. Louis Fed’s 5-year Breakeven Inflation Rate has fallen to 2.73%, and the 5-year/5-year Forward Inflation Expectation Rate is only 2.41%. Also, the University of Michigan Inflation Expectations survey of consumers, median expected price change, are at 4.8% for the next 1 year and 2.9% for the next 5 years.
     
  7. Gold prices continue to languish due to the ultra-strong dollar and expectations for rising real interest rates (nominal rate minus inflation). Historically, gold thrives when inflation rises and real interest rates fall, leading to a weaker dollar, which makes gold attractive as a store of value. But there has been no rush among investors to hold gold.

Of course, Fed monetary policy can only impact demand; it has no impact on disrupted global supply chains. The Fed can only withdraw stimulus by unwinding QE (i.e., letting bonds on its balance sheet mature and/or selling some into the market) and raising interest rates to the “neutral rate.” In fact, I believe we are close to that elusive neutral rate, given how sensitive the highly leveraged US and global economies (consumers, businesses, and governments) have become to debt financing costs. Moreover, the Fed must ensure sufficient global supply of dollars in a world hungry for them (85% of foreign exchange transactions, 60% of foreign exchange reserves, and 50% of cross-border loans and international debt are in US dollars.) All ears will be on the September FOMC meeting on 9/21, when the Fed may announce a final rate hike followed by language indicating that it will “wait & see” how conditions develop going forward (in spite of the tone of Powell's written speech on Friday). 

smartindale / Tag: inflation, federal reserve, CPI, PPI, GSCPI, FOMC, stocks, neutral rate, interest rates / 0 Comments

Pages