Performance: Baker's Dozen Investment, Compounded Six Years
The following charts show an investment of $10,000 in the Baker's Dozen Portfolio over six years. Chart 1 shows the compounded interest on a single investment of $10,000 in year one. Chart 2 shows the compounded interest on a investment of $10,000 at the start of each year.
Chart 1: $10,000 invested in 2009
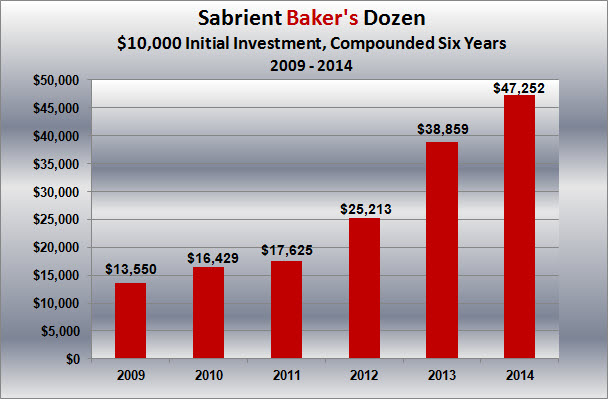
Chart 2: $10,000 invested in at the start of each year.
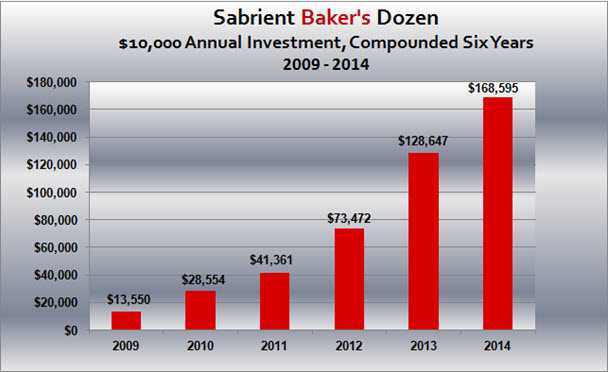
Calculations by Sabrient.
Note: Past performance is not a guarantee of future results.