The Trump Bump: An Earnings Quality Analysis
 By Byron MacLeod, CFA
Associate Director of Research, Gradient Analytics, LLC
“Whatever you are, be a good one.” – Abraham Lincoln
We at Gradient Analytics are accounting experts. We evaluate companies for earnings sustainability, financial engineering, and accounting mismanagement. Unfortunately, many investors and portfolio managers may be unaware of the variety of levers enabling managers to aggressively recognize revenue, temporarily boost earnings, overstate assets, hide liabilities, or grow through acquisitions. Unaware investors can suddenly find that their supposedly “safe” investments have turned sour on them.
By monitoring the true quality of earnings, it becomes easier to judge a company’s true financial health.
The “Trump Bump” & Rising Correlations
Though the market appears to be recently dominated by Trump’s potential impact on the American economy, earnings quality trends continue to be relevant to stock prices. Read more
The recent rally since the US presidential election appears to be a broad-based rally, with many different sectors benefiting. However, since the advent of the ETF, more and more often capital is transferred from and to sectors based upon these broad-based funds. As a result, when markets move strongly, the correlation of the underlying stocks tends to spike and the basket of stocks all tend to move together. When ”all boats are lifted,” regardless of the underlying quality of the businesses, this creates over-valued business that investors may want to reexamine.
Vigilant investors and portfolio managers can take advantage of these broad-based movements in the market by monitoring a given company’s underlying quality of earnings. When the share price moves up strongly but the quality of the earnings declines, it may be time to sell a long position, and in some cases put on a short.
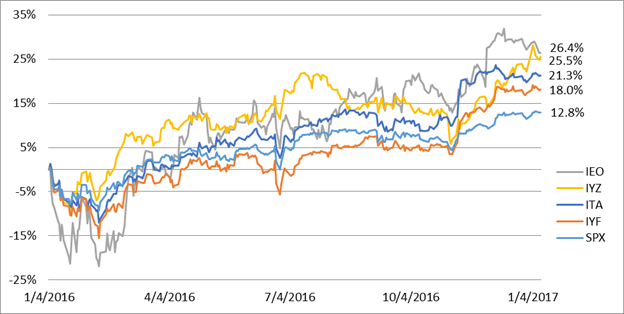
We will discuss firms from four different sectors that have all rallied strongly, especially over the last two months: finance, oil, telecom, and defense. Over the last year, the IYF (financial ETF), IEO (oil ETF), IYZ (telecom ETF), and ITA (defense ETF) have risen by 18%, 26%, 26%, and 21% respectively.
Financials: A Tale Of Bad Loans & Loan Loss Reserves
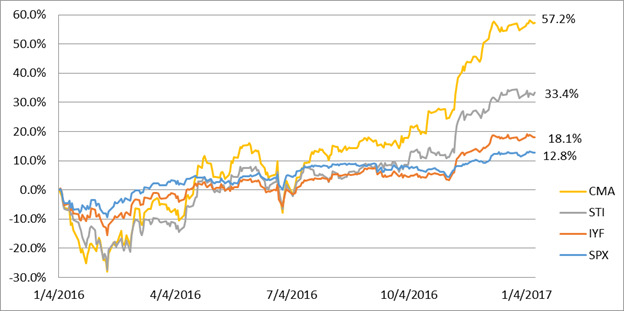
While the financial sector saw tremendous price appreciation, not all banks were able to grow without a decline in quality. For example, one banking stock that has seen a significant rise in earnings quality risk over the last year is Sun Trust Banks, Inc. (STI).
In the last twelve months, its non-performing loans (NPLs) have risen by 105% year-over-year (YOY). At the same time, the bank’s allowance for loan losses (ALL) has fallen 3% YOY. While the firm remains well-capitalized with an ALL-to-NPL ratio of 1.6x, this is a substantial drop from the ALL-to-NPL ratio of 3.3x last year.
We feel that any analysis of STI should account for the recent rise in non-performing loans. To that very point, if we assume that STI’s ALL account rose in parallel with its NPLs, this would have reduced STI’s trailing 12 months (TTM) earnings before taxes (EBT) by 18%. Instead, STI’s as reported EBT rose 1% YOY to $2.7B.
Current STI shareholders may be caught off-guard by an increase in ALL provisions which would pressure margins in future quarters. Given this material risk to STI’s forward earnings, we feel the recent 22% share price increase since 11/4/2016 may not be warranted.
Similar to STI, there has been a large rise in Comerica Incorporated’s (CMA) NPLs over the last year without a corresponding increase in the firm’s ALL. CMA’s NPL jumped 73% YOY, while the ALL account rose just 6%.
Although the credit risk of this portfolio appears to be rising, CMA’s ALL-to-NPL ratio fell from 1.5x in Q3 2015 to just 0.9x in Q3 2016. Concerningly, the $279m YOY rise in NPLs amounted to a significant portion of the bank’s earnings. If we assume that management had fully provisioned the rise in NPLs beyond just the $36m YOY rise in the ALL account, TTM EBT would have been just $415m, or down 49% on a YOY basis. Given this potential compression of earnings, we believe the 25% rise in the bank’s forward earnings multiple (from 14x as of 12/31/15 to a current multiple of 18x) may fail to account for this rise in earnings quality risk.
Telecom: Two Big Clients Are Souring QCOM’s Balance Sheet
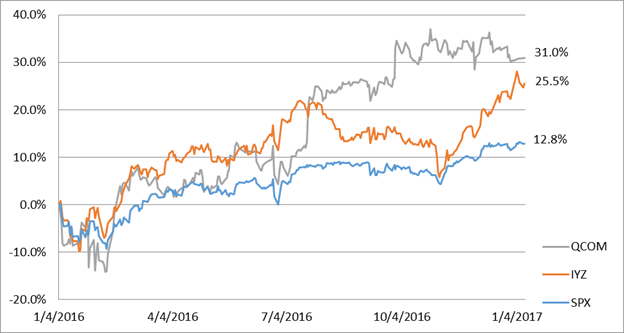
Switching industries, it appears that the telecom industry has also run up quite significantly since the US election results. One stock that has done well is QUALCOMM, Inc. (QCOM).
Over the last year, TTM operating income fell by 9% YOY, while at the same time, the firm’s TTM interest expense jumped 186% YOY. Unearned revenue, which consists primarily of license fees for intellectual property, fell 6% YOY. QCOM’s receivables also climbed 13%. Management attributed the rise in receivables to timing issues in the collection of payments.
However, what management failed to make clear in its filings was that the rise in AR appears to be due entirely to its largest two customers.
In fact, while total AR is up $252m YOY, AR from just these two customers is up $602m. Even more interesting, it appears that sales for these two customers has dropped faster than average, down 17% YOY versus the aggregate 7% YOY decline in QCOM’s sales.
Oil & Gas: High Fliers With Questionable Revenue Quality
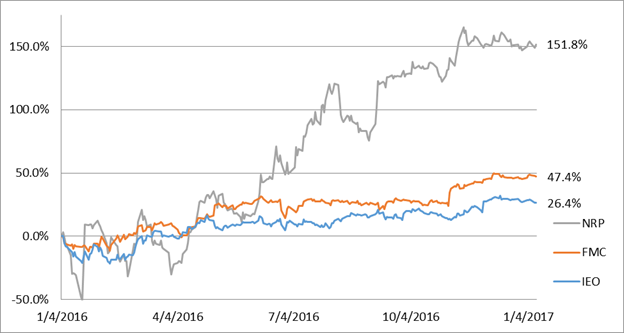
The oil and gas sector has also rebounded substantially off of its lows in 2016. Since November 4, 2016, the oil ETF XOP has outperformed the S&P500 by roughly 12%, rising a remarkable 19% in under three months. One oil and gas stock that has done particularly well is FMC Corp (FMC). Since 1/11/16, shares have risen 41%, impacted in large part by the June 2016 announcement of a pending merger with Technip. While this merger is set to close shortly in Q1 2017, any investors that plan to hold his/her shares post-merger should be aware of the shift in FMC’s quality of earnings.
During the last year, FMC’s order backlog fell 39% YOY as of 09/30/2016. In addition, inbound orders fell an even greater 52% YOY. Over the last year, FMC’s book-to-bill ratio has averaged just 0.6. Even more troubling, in the latest quarter, FMC warned that given the recent downturn in the oilfield services industry, many of its key customers had requested price concessions. One of FMC’s primary customers in Brazil is re-scheduling and may actually cancel certain backlog deliveries.
With the potential risks to FMC’s future earnings even greater than those represented on the current financials, we feel the substantial rise in its share price may not be warranted.
Another firm that has undergone a significant rise in its share price over the last year is Natural Resource Partners (NRP), whose stock rebounded over 5x from a low of $6.90 on 1/20/16 to $34.90 on 1/12/17. While this share price appreciation has been largely due to a rebound in coal expectations, we nevertheless still feel that there is a variety of earnings quality risks present.
NRP’s revenue from production minimums jumped $48m YOY to $61m. 84.2% of this minimum payment revenue was from lessees forfeiting the right to recoup previous payments from NRP, in exchange for the transfer of its mineral rights to the lessee. These transactions looked much more like an asset sale, which should be excluded from an analysis of sustainable earnings, rather than the continual recapture of deferred sales.
Furthermore, at the same time, total deferred revenue fell 30% YOY. This further eroded NRP’s balance sheet in support of the firm’s future sales.
Defense: A Satellite Company’s Fall From The Heavens
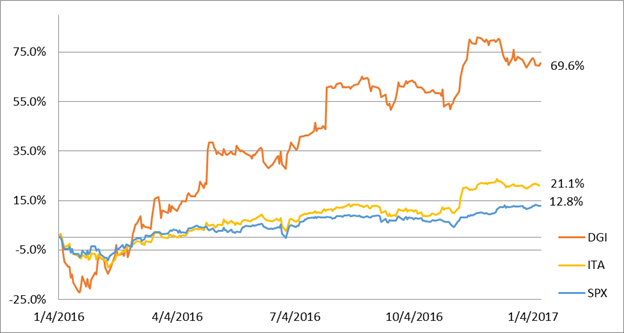
The defense sector has risen sharply since the election, largely on hopes that a united Republican front will be fairly accommodating. DigitalGlobe, Inc. (DGI), who produces high-resolution images and services sourced from its satellite constellation, also saw its share price rise along with the defense sector, increasing 70% YOY.
While shareholders may be optimistic about the recent acquisition of The Radiant Group in October 2016, we nevertheless remain concerned. Fundamentals don’t appear to be robust, with TTM sales up just 1% YOY, and there are several lingering earnings quality issues.
First of all, most of the $38m growth in TTM operating income, has come from cutting DGI’s SG&A expense. Most of the cost savings came from maintaining a lower headcount and spending less on consulting fees. Without growing top-line sales, this is an unsustainable way to grow earnings.
Additionally, during this period of flat-lining sales, deferred revenue has fallen 14% YOY. The reason for the decline was largely due to the burn-off of its government contracts. The firm’s backlog also declined by 8% YOY, adding further concerns about DGI’s ability to accelerate future sales.
A last, lingering concern we have pertains to DGI’s TTM interest expense, which fell 38% YOY. This drop was due to DGI allocating a higher percentage of its total interest expense to capital projects, mainly its new WorldView-4 constellation. As a result, the ongoing business is now carrying a substantially lighter interest load. In fact, this $12m drop in DGI’s interest expense accounted for 26% of the YOY increase in DCI’s earnings before taxes.
Putting it all together, we wonder if the NTM P/E ratio of 71.0x is too expensive a price given the risks laid out above.
“It is far better to be alone, than to be in bad company.” – George Washington
We at Gradient Analytics believe that earnings quality signals will always be relevant and informative to investors. This is especially so when we see broad-based movements in the market that fail to reward or punish individual firms for their specific balance sheet risks.
However, as stated before, we shouldn’t bemoan these movements, but rather look to capitalize on this blind spot in the market.
Whatever your investing strategy may be, we’d like to wish you all the best of luck in 2017 from us here at Gradient Analytics.