Sector Detector: Transports try to prod bulls through tough resistance
 The Dow Jones Transportation Index is up an impressive +16.7% year-to-date through Wednesday, as it runs interference for the broader Dow Industrials (up +10.8%) and tries to prod the bulls ahead. But the all-time closing high of 1565 on the S&P 500 is proving to be formidable resistance, particularly with investors skittish about Cyprus, Italy, and the EU, coupled with low trading volume as we head toward the end of this holiday-shortened week. The transports often foreshadow stronger gains ahead for the blue chips, so bulls have been eager to add new recruits to their ranks. Every minor pullback has been taken as a buying opportunity.
By the way, the top performing transportation stock has been Alaska Air Group (ALK), which happens to be one of Sabrient's "Baker's Dozen" top stocks for 2013: http://www.sabrientsystems.com/bakers-dozen
As we close Q1, looking at the ten U.S. sector iShares, defensive sectors Healthcare (IYH) and Consumer Goods (IYK) have been the performance leaders on a year-to-date basis, with returns of +14.5% and +12.8%, respectively. Close behind, Financial (IYF), Consumer Services (IYC), Energy (IYE), Utilities (IDU), and Industrial (IYJ) are also looking strong with virtually identical YTD performance among them, right around +11%.
The bottom three performers have been Telecom (IYZ), which is actually slightly negative year-to-date, Basic Materials (IYM), and Technology (IYW). Tech is a surprise, given the bullish market and IYW’s consistently strong Outlook score, but it is up only +3.6% YTD. This underperformance has let it maintain a low relative valuation that has helped keep its fundamentals-based Sabrient Outlook score high. Investors seem nervous about Tech names lately, and of course, a prime culprit holding down performance has been Apple (AAPL), with its extraordinarily high weighting in the ETF of 17% and extraordinarily poor YTD return of -15% (along with its hard-to-quantify impact on Tech-investor psychology).
Some analysts are opining that consumer cyclical products are facing growth challenges, while consumer non-cyclicals are well-positioned to do well this next earnings season. And in fact, Sabrient’s latest fundamentals-based SectorCast ETF rankings reflect this view.
The S&P500 SPDR Trust (SPY) closed Wednesday at 156.19, and in fact it has created a sideways channel between about 153 and 156.5, which happens to be its all-time closing high. After falling out of its earlier bullish rising channel, it has been unable to break back in. Oscillators RSI, MACD, and Slow Stochastic are all looking mostly neutral right now, and Bollinger Bands are pinching together in the shape of a crab claw during this technical consolidation beneath the all-time high. Low volume during this holiday-shortened week (Good Friday) has made it tough for the bulls to recruit sufficient reinforcements for their assault. Perhaps we’ll see it next week.
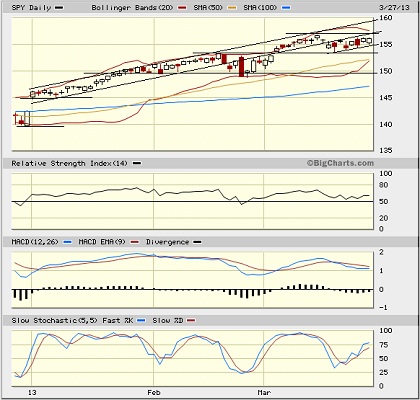
The CBOE Market Volatility Index (VIX), a.k.a. “fear gauge,” closed Wednesday at 13.15, which is still incredibly low given the global uncertainties. Safe-haven gold is moribund. Equity valuations remain reasonable and the risk premium is high, even while the market is at new highs, and many market observers are calling an imminent market top. It all bodes well for more upside.
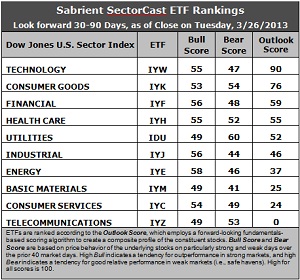
Latest rankings: The table ranks each of the ten U.S. industrial sector iShares ETFs by Sabrient's proprietary Outlook Score, which employs a forward-looking, fundamentals-based, quantitative algorithm to create a bottom-up composite profile of the constituent stocks within the ETF. The multi-factor model considers forward valuation, historical earnings trends, earnings growth prospects, the dynamics of Wall Street analysts' consensus estimates, accounting practices and earnings quality, and various return ratios. In addition, the table also shows Sabrient's proprietary Bull Score and Bear Score for each ETF.
High Bull score indicates that stocks within the ETF have tended recently toward relative outperformance during particularly strong market periods, while a high Bear score indicates that stocks within the ETF have tended to hold up relatively well during particularly weak market periods. Bull and Bear are backward-looking indicators of recent sentiment trend.
As a group, these three scores can be quite helpful for positioning a portfolio for a given set of anticipated market conditions.
Observations:
1. Technology (IYW) continues to hold the top spot, with a robust Outlook score of 90. IYW remains strong across the board with a low forward P/E, solid support from Wall Street analysts, strong projected long-term growth, and the best return ratios. Defensive sector Consumer Goods (IYK) is now in second with a 76 after rising an impressive 38 points due to a rash of upward earnings revisions and consistently strong return ratios. Financial (IYF) falls to third with a 59 as fewer analysts saw fit to revise upward heading into earnings season.
2. Telecom (IYZ) stays in the cellar with a rock-bottom Outlook score of 0. It has the least support (negative earnings revisions) among Wall Street analysts, the worst return ratios, the highest (worst) forward P/E, a low projected long-term growth rate, and poor insider sentiment. It is joined in the bottom two this week by Consumer Services (IYC) with a score of 24, as Materials (IYM) barely slipped ahead by one point. Forward valuations continue to plague stocks within IYC.
3. Overall, this week’s rankings have taken on a neutral tone, as IYK, IYH, and IDU look strong, with rankings in the top five and Outlook scores above 50, while IYJ, IYE, IYM, and IYC are all in the bottom half and scoring well below 50. The wide top-bottom spread of 90 points continues to reflect greater analyst conviction.
4. Looking at the Bull scores, Energy (IYE) remains the leader on particularly strong market days, scoring 58. Defensive sectors Utilities (IDU) and Telecom (IYZ) join Basic Materials (IYM) as the laggards on strong market days, scoring 49. The top-bottom spread is only 9 points, which continues to indicate high correlation on strongly bullish days.
5. Looking at the Bear scores, Utilities (IDU) is serving as the favorite “safe haven” on weak market days, scoring 60. Basic Materials (IYM) is the worst during market weakness as reflected in its low Bear scores of 41. The top-bottom spread is 19 points, which indicates lower correlations when the market is particularly weak, i.e., it pays to be in the right sectors when the market is weak.
6. Overall, Technology (IYW) shows the best all-weather combination of Outlook/Bull/Bear scores. Adding up the three scores gives a total of 192. Telecom (IYZ) is by far the worst at 102. Looking at just the Bull/Bear combination, defensive sector Utilities (IDU) remains at the top with a total score of 109, followed closely by Healthcare (IYH) and Consumer Goods (IYK). Materials (IYM) displays by far the lowest score at 90. This indicates that Utilities stocks have tended to perform the best in extreme market conditions (whether bullish or bearish) while Materials stocks are avoided altogether.
These Outlook scores represent the view that Technology and Consumer Goods sectors may be relatively undervalued, while Telecom and Consumer Services sectors may be relatively overvalued based on our 1-3 month forward look.
Top-ranked stocks within Technology and Consumer Goods include F5 Networks (FFIV), CACI International (CACI), Energizer Holdings (ENR), and Whirlpool Corp (WHR).
Disclosure: Author has no positions in stocks or ETFs mentioned.
About SectorCast: Rankings are based on Sabrient’s SectorCast model, which builds a composite profile of each equity ETF based on bottom-up aggregate scoring of the constituent stocks. The Outlook Score employs a fundamentals-based multi-factor approach considering forward valuation, earnings growth prospects, Wall Street analysts’ consensus revisions, accounting practices, and various return ratios. It has tested to be highly predictive for identifying the best (most undervalued) and worst (most overvalued) sectors, with a 1-3 month forward look.
Bull Score and Bear Score are based on the price behavior of the underlying stocks on particularly strong and weak days during the prior 40 market days. They reflect investor sentiment toward the stocks (on a relative basis) as either aggressive plays or safe havens. So, a high Bull score indicates that stocks within the ETF have tended recently toward relative outperformance during particularly strong market periods, while a high Bear score indicates that stocks within the ETF have tended to hold up relatively well during particularly weak market periods.
Thus, ETFs with high Bull scores generally perform better when the market is hot, ETFs with high Bear scores generally perform better when the market is weak, and ETFs with high Outlook scores generally perform well over time in various market conditions.
Of course, each ETF has a unique set of constituent stocks, so the sectors represented will score differently depending upon which set of ETFs is used. For Sector Detector, I use ten iShares ETFs representing the major U.S. business sectors.
About Trading Strategies: There are various ways to trade these rankings. First, you might run a sector rotation strategy in which you buy long the top 2-4 ETFs from SectorCast-ETF, rebalancing either on a fixed schedule (e.g., monthly or quarterly) or when the rankings change significantly. Another alternative is to enhance a position in the SPDR Trust exchange-traded fund (SPY) depending upon your market bias. If you are bullish on the broad market, you can go long the SPY and enhance it with additional long positions in the top-ranked sector ETFs. Conversely, if you are bearish and short (or buy puts on) the SPY, you could also consider shorting the two lowest-ranked sector ETFs to enhance your short bias.
However, if you prefer not to bet on market direction, you could try a market-neutral, long/short trade—that is, go long (or buy call options on) the top-ranked ETFs and short (or buy put options on) the lowest-ranked ETFs. And here’s a more aggressive strategy to consider: You might trade some of the highest and lowest ranked stocks from within those top and bottom-ranked ETFs.