Sector Detector: Stocks succumb to the “new news”
 Market timing is tough duty. Even as stocks have risen inexorably and we all knew it couldn’t go up in a straight line, still picking tops is hard. You can be wrong for a long time, and either lose your shirt shorting the market, or miss out on big gains by staying out. Well, it appears that all those previous bullish catalysts are played out, at least for the moment, and the annual ritual of April pullbacks might be kicking in yet again.
Is it because of the April ritual or anticipation of “Sell in May and go away”? No, I think it is more due to the new type of news events we have been getting lately. Rather than the usual financial reports to which investors have grown immune focusing on EU debt, China growth, Federal budgets, municipal pensions, and corporate earnings, the “new” news is more in the form of military threats and terrorism here at home (like bombs and poison letters). In any case, it has caused investor paralysis and bulls have suddenly lost the mojo that they had apparently regained just last week. The technical breakout of the S&P 500 above its all-time highs has failed, and it is back to testing important support levels.
Still, the Fed's QE3 liquidity spigot continues to flow, which has helped support equity prices and the housing recovery, albeit at a rate that leaves many unsatisfied. But this lengthy U.S. economic recovery cycle, with its low inflation and low borrowing costs, is allowing corporate earnings and revenues to grow while lending a stabilizing force to a fragile global economy. On the other hand, the hawks in the FOMC are taking a new tact of reverse-psychology to try to bring an early end to the doves’ bond-buying by asserting that QE3 hurts the masses, including those living on fixed income, while mainly making the rich richer. You might call it collateral damage.
This year’s rally has been led by defensive sectors: Healthcare, Utilities, and Consumer Goods, and even Telecom has made a recent surge. And this general investor conservatism is also reflected in the outperformance of developed markets over emerging markets and value over growth, and the popularity of dividend-paying blue chips.
Hot-money-driven “junk rallies” are usually indicative of momentum trading leading to “blow-off tops” rather than sustainable long-term investing. But the prevailing preference for defensive sectors, value, and dividends tells me that investors are cautious but committed to staying in equities, and any selling should be contained.
Looking at the charts, the S&P500 SPDR Trust (SPY) closed Wednesday at 155.11. Last week, it broke out strongly above the sideways channel between about 153.5 and 157 that had been in place since early March. But SPY now finds itself back inside the channel and testing support at the bottom of the channel. The 20-day simple moving average has been providing short-term support, and in fact price managed to close right at the 20-day on Tuesday. The 40-day SMA has provided reliable secondary support, and in fact it closed Wednesday right at the 40-day after briefly violating support intraday. Oscillators RSI, MACD, and Slow Stochastic are all pointing down now, but only Slow Stochastic is approaching oversold territory.
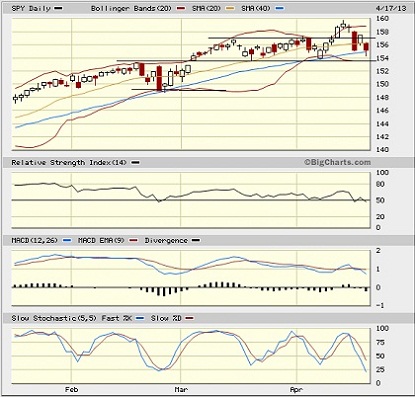
The CBOE Market Volatility Index (VIX), a.k.a. “fear gauge,” has been a yo-yo lately. After closing last week below 12, it popped up near 17 on Monday, closed back down below 14 on Tuesday, and then went as high as 17.90 on Wednesday before closing at 16.51. It is still at levels that are historically considered complacent, but in the current VIX environment, anything approaching 20 is showing elevated fear, and above 20 indicates a selloff in progress.
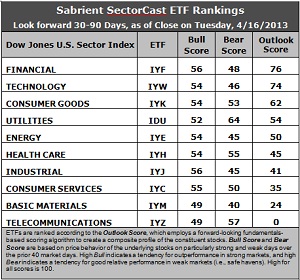
Latest rankings: The table ranks each of the ten U.S. industrial sector iShares ETFs by Sabrient's proprietary Outlook Score, which employs a forward-looking, fundamentals-based, quantitative algorithm to create a bottom-up composite profile of the constituent stocks within the ETF. The multi-factor model considers forward valuation, historical earnings trends, earnings growth prospects, the dynamics of Wall Street analysts' consensus estimates, accounting practices and earnings quality, and various return ratios. In addition, the table also shows Sabrient's proprietary Bull Score and Bear Score for each ETF.
High Bull score indicates that stocks within the ETF have tended recently toward relative outperformance during particularly strong market periods, while a high Bear score indicates that stocks within the ETF have tended to hold up relatively well during particularly weak market periods. Bull and Bear are backward-looking indicators of recent sentiment trend.
As a group, these three scores can be quite helpful for positioning a portfolio for a given set of anticipated market conditions.
Observations:
1. Financial (IYF) has moved into the top ranking with an Outlook score of 76, followed by Technology (IYW) at 74 (which is the same as last week’s score). IYF continues to see its score gradually rise, while defensive sector Consumer Goods (IYK) saw its score fall a few more points down to 62 to hold on to third place. IYW continues to display a low forward P/E, strong projected long-term growth, and the best trailing return ratios, while IYF took the lead on the basis of its favorable forward P/E and strong support among Wall Street analysts (i.e., net upgrades in forward earnings estimates).
2. Telecom (IYZ) stays in the cellar with an Outlook score of 0. It is among the worst in every metric in the model, particularly forward P/E, trailing return ratios, and insider sentiment. It is joined in the bottom two again this week by Basic Materials (IYM), which received a number of downward earnings revisions from the sell side.
3. This week’s rankings maintain an overall neutral tone, although the bias appears to be gradually swinging back to the bullish side. This week, I’m noticing the rise in Financial at the expense of Healthcare. Defensive sectors IYK and IDU still rank in the top five, while economically-sensitive sectors IYJ, IYM, and IYC are all in the bottom half.
4. Looking at the Bull scores, Financial (IYF) and Industrial (IYJ) are the leaders on particularly strong market days, scoring 56. Basic Materials (IYM) joins Telecom (IYZ) as the laggards on strong market days, scoring 49. But the top-bottom spread is quite narrow at only 7 points, which continues to indicate high sector correlation on strongly bullish days.
5. Looking at the Bear scores, Utilities (IDU) is serving as the favorite “safe haven” on weak market days, scoring 64, while Basic Materials (IYM) is by far the worst during extreme market weakness as reflected in its low Bear score of 40. The top-bottom spread has widened further to 24 points, which indicates lower correlations on weak market days -- i.e., it pays to be in the safe sectors when the market is bearish.
6. Overall, Financial (IYF) shows the best all-weather combination of Outlook/Bull/Bear scores. Adding up the three scores gives a total of 180. Telecom (IYZ) is the worst at 106. Looking at just the Bull/Bear combination, Utilities (IDU) shows an impressive total score of 116. Materials (IYM) displays by far the lowest score at 89. This indicates that Utilities stocks have performed the best in extreme market conditions (whether bullish or bearish) while Materials stocks are avoided altogether.
These Outlook scores represent the view that Financial and Technology sectors may be relatively undervalued, while Telecom and Basic Materials sectors may be relatively overvalued based on our 1-3 month forward look.
Some top-ranked stocks within Financial and Technology include Everest Re Group (RE), Citigroup (C), ValueClick (VCLK), and Cree Inc (CREE).
Disclosure: Author has no positions in stocks or ETFs mentioned.
About SectorCast: Rankings are based on Sabrient’s SectorCast model, which builds a composite profile of each equity ETF based on bottom-up aggregate scoring of the constituent stocks. The Outlook Score employs a fundamentals-based multi-factor approach considering forward valuation, earnings growth prospects, Wall Street analysts’ consensus revisions, accounting practices, and various return ratios. It has tested to be highly predictive for identifying the best (most undervalued) and worst (most overvalued) sectors, with a 1-3 month forward look.
Bull Score and Bear Score are based on the price behavior of the underlying stocks on particularly strong and weak days during the prior 40 market days. They reflect investor sentiment toward the stocks (on a relative basis) as either aggressive plays or safe havens. So, a high Bull score indicates that stocks within the ETF have tended recently toward relative outperformance during particularly strong market periods, while a high Bear score indicates that stocks within the ETF have tended to hold up relatively well during particularly weak market periods.
Thus, ETFs with high Bull scores generally perform better when the market is hot, ETFs with high Bear scores generally perform better when the market is weak, and ETFs with high Outlook scores generally perform well over time in various market conditions.
Of course, each ETF has a unique set of constituent stocks, so the sectors represented will score differently depending upon which set of ETFs is used. For Sector Detector, I use ten iShares ETFs representing the major U.S. business sectors.
About Trading Strategies: There are various ways to trade these rankings. First, you might run a sector rotation strategy in which you buy long the top 2-4 ETFs from SectorCast-ETF, rebalancing either on a fixed schedule (e.g., monthly or quarterly) or when the rankings change significantly. Another alternative is to enhance a position in the SPDR Trust exchange-traded fund (SPY) depending upon your market bias. If you are bullish on the broad market, you can go long the SPY and enhance it with additional long positions in the top-ranked sector ETFs. Conversely, if you are bearish and short (or buy puts on) the SPY, you could also consider shorting the two lowest-ranked sector ETFs to enhance your short bias.
However, if you prefer not to bet on market direction, you could try a market-neutral, long/short trade—that is, go long (or buy call options on) the top-ranked ETFs and short (or buy put options on) the lowest-ranked ETFs. And here’s a more aggressive strategy to consider: You might trade some of the highest and lowest ranked stocks from within those top and bottom-ranked ETFs.