Sector Detector: Stocks rally off long-term support levels while the Wall of Worry rises ever higher
The Wall of Worry just keeps adding more bricks. Although there has been much talk about the impact of low oil prices on the U.S. high yield debt market and by extension the U.S. banks that did the lending, the bigger worry now is the stability of the European banking system. It is like 2011 all over again. Also, there continue to be signs of an insidious corporate “earnings recession.” Such headlines add to the steady stream of “worry bricks” that have so confounded disciplined fundamental investors for at least the past seven months or so. Even Morgan Stanley came out recently to say that January was the worst for its investment portfolios in more than five years. Given the modern prevalence of short attention spans and the need for instant gratification, all of this begs the question as to whether one should throw out the concept of investing based on fundamentals, quality, and strong forward valuations if no one really knows what’s going to happen next for all of these companies that have been painstakingly analyzed. Instead, should we simply trade -- or perhaps fade -- the momentum?
Well, that’s not what investing is all about. That’s trading. And history tells us that markets eventually reward higher quality business models, balance sheets, management, products, service, etc. over time. So, the real question from an investment standpoint becomes whether to assume a bullish or defensive posture.
In this weekly update, I give my view of the current market environment, offer a technical analysis of the S&P 500 chart, review our weekly fundamentals-based SectorCast rankings of the ten U.S. business sectors, and then offer up some actionable trading ideas, including a sector rotation strategy using ETFs and an enhanced version using top-ranked stocks from the top-ranked sectors.
Market overview:
Institutional money flows (i.e., the so-called “smart money”) turned sharply in favor of equities a few weeks ago, even while individual investors were shying away, and indeed the markets responded, surging higher last week. But if we look back to the previous Friday, February 12, the Russell 2000 small-cap index had plunged more than 25% off its high and emerging markets were down 34% from their highs. China had its slowest growth last year in 25 years. From a sector standpoint, Financial, Healthcare (primarily biotech), Basic Materials, Industrial (primarily transportation) have all fallen in excess of 20%, and of course Energy (primarily oil & gas) has been decimated, falling more than 55%. But much of this has been masked by the performance of the major large cap indexes, especially the NASDAQ 100 and S&P 500, which have benefited from their large cap focus and market cap weighting, given the extremely poor market breadth.
The CBOE Market Volatility Index (VIX), a.k.a. fear gauge, closed Friday at 20.53 and has been steadily falling since briefly touching above 30 on February 11. ConvergEx asked the question of why the VIX hasn’t breached the 40 mark like it did during the market turmoil last August. They pointed out that only the Energy and Financial sectors are showing the big volatility this time around, Technology (the highest weighted sector) has only reached 30 instead of the 40 level it hit last August.
The flight to safety among global investors has continued to push capital into U.S. Treasuries. The 10-year Treasury yield closed Friday at 1.75%, and it has traded in a range from 1.57 to 1.85 since February 11. Two-year yields closed Friday at 0.76%. Compared to two weeks ago, the 10-year is flat while the 2-year is up significantly from 0.67% -- in other words, the yield curve has flattened even further. As for the Fed’s path toward normalizing the fed funds rate, after Janet Yellen’s latest testimony, the fed funds futures are now pricing a slightly higher probability of a March rate hike at 2% (as opposed to 0% two weeks ago), June at 18%, and December at only 38%, with only a 7% chance that we will see two rate hikes this year.
Nevertheless, the FOMC is still trying to talk up an improving economy and keep the possibility of four rate hikes this year on the table. Whether or not the Fed hikes at all this year, it can’t be ignored that the M2 money supply is currently growing at a robust 9% annual rate. This is an under-the-radar stimulus tactic that doesn’t get a ton of press (like the quarter point hike in December), and in fact commercial/industrial lending has been growing. This shows that the Fed is more interested in normalizing rates than in tightening monetary policy.
After all, there is no looming threat of inflation. Quite the contrary, deflation has been the nemesis and the resultant threat to the global economy due to the catastrophic decline in oil and commodity prices, which is not only threatening many energy and mining companies, but perhaps more critically the banks that have lent to them.
The true status of China’s economic growth has been another major worry among investors. Since 2008, the U.S. and China together have generated all global GDP growth when priced in dollars, with China the main contributor. However, demographics and the law of big numbers says that this amazing growth must come to an end, and some market observers are predicting India, with its rising population, is demographically poised to be the next big driver of global growth. Still, China’s share of global trade now stands at 27%, which is pretty phenomenal when you consider how much it has grown in such a short amount of time.
Although China might continue to grow at a healthy rate, when measured in US dollars real growth will undoubtedly be weak. Either it will have slow nominal growth (i.e., real growth plus inflation) and a strong yuan, or faster nominal growth via a major currency devaluation. In any case, we expect that it is the good ol’ US of A that will continue as the one consistent shining light to keep the global economic candle burning.
Keep in mind, the U.S. is by far the world’s wealthiest nation as measured by GDP, which this year should hit $18 trillion. That amount is as much as the next three largest economies in the world (i.e., China, Japan and Germany) combined. And despite all of the noise and frightening headlines, the fundamentals of the U.S. economy show no evidence of impending recession and equities still look attractive to us, with historically reasonable forward valuations. Last week, the Atlanta Fed GDPNow forecasting model, which provides a hint of the official estimate prior to its release, forecasted that real GDP growth (seasonally adjusted annual rate) in the first quarter of 2016 will be 2.6%.
Regarding the meltdown in oil prices, it has been driven by excess supply rather than falling demand, so it is not signaling a global recession. China’s slowing growth and shift from a manufacturing to service industry focus is certainly impacting energy demand, but energy demand growth has been mostly steady for several years and relied more on the developed economies. In fact, the oversupply may transition into balance later this year given that production has fallen dramatically while demand continues to rise (although there is plenty of oil stored in situ and ready to come on line once price justifies it). Moreover, the correlation between oil and equities has been driven at least partly by liquidations from sovereign wealth funds of the major oil-producing countries, which must raise cash to make up for their budget shortfall in oil revenues.
Here at Sabrient, we don’t spend a lot of time ruminating like economists about macro predictions. Instead, our quant models build a bottom-up view of the world, aggregating the many micro views of market segments from the sell-side analyst community to create an overall macro picture. And with this approach, our latest Baker’s Dozen portfolio of top stock picks for the year ahead is very U.S. consumer-centric.
Indeed, First Trust pointed out that average hourly earnings over the past six months have risen at a 2.9% annual rate, which is the fastest for any six-month period since the current economic expansion started. Consumer confidence and spending are solid, as evidenced by cars, housing, and entertainment sales. Furthermore, S&P Dow Jones Indices observed that the ratio of high-yield debt prices to investment-grade corporate debt prices has now reached the 50% retracement level from the uptrend that started in March 2009, which may signal a logical reversal point and a situation that is favorable for equities.
SPY chart review:
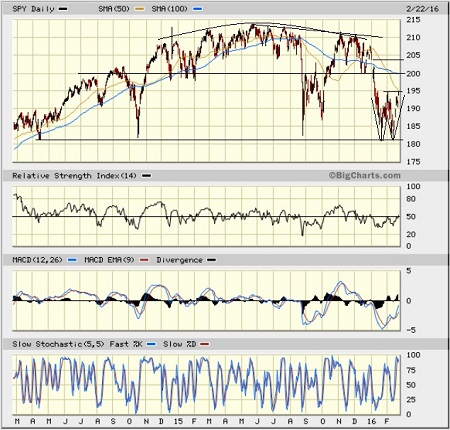
The SPDR S&P 500 Trust (SPY) closed on Monday at 194.78 after bouncing strongly from the support line of “last resort,” so to speak, which demarks the low around 182 going back to April 2014. The recent solid performance is giving hints of a bullish W-pattern forming, which is similar to the pattern forming in oil as the two continue to display strong correlation. To confirm the W-pattern, price would have to close solidly above the center of the W, which is right here around 195. If it fails to move higher at this point, price could possibly retest the 182 major support line -- where failure is not a pleasant option. SPY is now above its short-term 20-day simple moving average (which has turned upwards), and it is testing resistance at its 50-day simple moving average (which is still pointing sharply downwards); however, it still remains below its 100-day (near 200) and 200-day SMA (near 203). The long-term low near 182 dating back to April 2014 -- and retested in October 2014, August 2015 -- has been successfully tested for support a couple of times this year already. Oscillators RSI, MACD, and Slow Stochastic are all in essentially neutral positions that could go either way. On the upside, the 200 resistance level will be a tough test, but the bearish gap down from 204 at the beginning of the year should act as a magnet. Beyond that, there is a line of lower highs since last May as well as a broad rounding top to contend with, once it gets above 204.
Latest sector rankings:
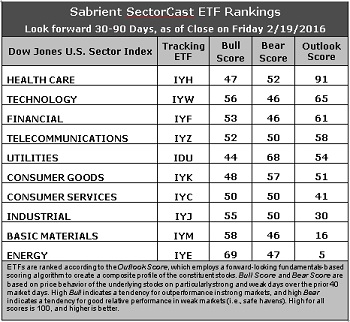
Relative sector rankings are based on our proprietary SectorCast model, which builds a composite profile of each equity ETF based on bottom-up aggregate scoring of the constituent stocks. The Outlook Score employs a forward-looking, fundamentals-based multifactor algorithm considering forward valuation, historical and projected earnings growth, the dynamics of Wall Street analysts’ consensus earnings estimates and recent revisions (up or down), quality and sustainability of reported earnings (forensic accounting), and various return ratios. It helps us predict relative performance over the next 1-3 months.
In addition, SectorCast computes a Bull Score and Bear Score for each ETF based on recent price behavior of the constituent stocks on particularly strong and weak market days. High Bull score indicates that stocks within the ETF recently have tended toward relative outperformance when the market is strong, while a high Bear score indicates that stocks within the ETF have tended to hold up relatively well (i.e., safe havens) when the market is weak.
Outlook score is forward-looking while Bull and Bear are backward-looking. As a group, these three scores can be helpful for positioning a portfolio for a given set of anticipated market conditions. Of course, each ETF holds a unique portfolio of stocks and position weights, so the sectors represented will score differently depending upon which set of ETFs is used. We use the iShares that represent the ten major U.S. business sectors: Financial (IYF), Technology (IYW), Industrial (IYJ), Healthcare (IYH), Consumer Goods (IYK), Consumer Services (IYC), Energy (IYE), Basic Materials (IYM), Telecommunications (IYZ), and Utilities (IDU). Whereas the Select Sector SPDRs only contain stocks from the S&P 500, I prefer the iShares for their larger universe and broader diversity. Fidelity also offers a group of sector ETFs with an even larger number of constituents in each.
Here are some of my observations on this week’s scores:
1. Healthcare retains the top spot by a wide margin with an Outlook score of 91. It displays relatively good Wall Street analyst sentiment (although still slightly negative net revisions to earnings estimates) and generally solid factor scores across the board, including a steadily improving (i.e., falling) forward P/E as the sector struggles to overcome headline risk. Technology stays in second place with an Outlook score of 65, as it also displays solid factor scores across the board, including the highest forward long-term growth rate. Financial takes the third spot once again with an Outlook score of 61 and continues to show the best (i.e., lowest) aggregate forward P/E (13x), although this has risen a bit as the sector gets pounded with net reductions to earnings estimates given the general rethinking of the future of interest rates and the shape of the yield curve. A surprise in fourth place this week is Telecom, which jumped due to receiving net positive revisions to sell-side earnings estimates. Rounding out the top six (which all score above 50) are Utilities and Consumer Goods (Staples/Noncyclical).
2. Energy remains at the bottom with an Outlook score of 5 as the sector scores among the worst in all factors of the GARP model, including the highest forward P/E (24.9x). Also, it is the only sector to display a negative long-term growth rate. Basic Materials takes the other spot in the bottom two with an Outlook score of 16 as commodity prices in general continue to languish along with oil prices. In fact, Materials is taking the brunt of the downward revisions to earnings estimates. The other two scoring in the bottom four are economically-sensitive sectors Industrial and Consumer Services (Discretionary/Cyclical).
3. Looking at the Bull scores, Energy tops the list with a robust 69, as investors do some bottom fishing on strong market days, while Utilities is the lowest at 44. The top-bottom spread is a wide 25 points, which reflects quite low sector correlations on strong market days, which is good for stock picking. It is generally desirable in a healthy market to see low correlations reflected in a top-bottom spread of at least 20 points, which indicates that investors have clear preferences in the stocks they want to hold (rather than broad risk-on behavior).
4. Looking at the Bear scores, Utilities (as usual) displays the top score of 68, which means that stocks within this sector have been the preferred safe havens on weak market days. Basic Materials, Technology, and Financial all score the lowest at 46, as investors flee during market weakness. The top-bottom spread is 22 points, which reflects low sector correlations on weak market days, which is good for stock picking. Ideally, certain sectors will hold up relatively well while others are selling off (rather than broad risk-off behavior), so it is generally desirable in a healthy market to see low correlations reflected in a top-bottom spread of at least 20 points.
5. Healthcare displays the best all-around combination of Outlook/Bull/Bear scores, while Basic Materials is now the worst. However, looking at just the Bull/Bear combination, Energy has emerged on top, followed by Utilities, indicating superior relative performance (on average) in extreme market conditions (whether bullish or bearish), while Healthcare and Financial are the worst, followed closely by Consumer Services (Discretionary/Cyclical).
6. This week’s fundamentals-based Outlook rankings still look mostly neutral, although the signs of bullishness I have talked about recently have given way to signs of defensiveness, given that Telecom, Utilities, and Consumer Goods (Staples/Noncyclical) are all in the top six. Nevertheless, the top three still comprise Healthcare (which is all-weather, so it’s not a strong indicator either way), Technology, and Financial. Keep in mind, the Outlook Rank does not include timing, momentum, or relative strength factors, but rather is a reflection of the fundamental expectations of individual stocks aggregated by sector.
Stock and ETF Ideas:
Our Sector Rotation model, which appropriately weights Outlook, Bull, and Bear scores in accordance with the overall market’s prevailing trend (bullish, neutral, or defensive), continues to reflect a defensive bias and suggests holding Utilities, Healthcare, and Consumer Goods (Staples/Noncyclical), in that order. (Note: In this model, we consider the bias to be defensive from a rules-based trend-following standpoint when SPY is below both its 50-day and 200-day simple moving averages.)
Other highly-ranked ETFs in SectorCast from the Utilities, Healthcare, and Consumer Goods (Staples/Noncyclical) sectors include First Trust Utilities AlphaDEX Fund (FXU), ProShares Ultra Health Care (RXL), and PowerShares Dynamic Food & Beverage Portfolio (PBJ).
Other notable ETFs that are highly ranked in our quant model include US Global Jets ETF (JETS), PowerShares Dynamic Leisure & Entertainment Portfolio (PEJ), iShares Mortgage Real Estate Capped ETF (REM), and Global X SuperDividend US ETF (DIV).
For an enhanced sector portfolio that enlists some top-ranked stocks (instead of ETFs) from within the top-ranked sectors, some long ideas from Utilities, Healthcare, and Consumer Goods (Staples/Noncyclical) sectors include NextEra Energy (NEE), Alliant Energy (LNT), Henry Schein (HSIC), Cigna (CI), The J.M. Smucker Co (SJM), and McCormick & Co (MKC). All are highly ranked in the Sabrient Ratings Algorithm.
If you prefer to take a neutral bias, the Sector Rotation model suggests holding Healthcare, Technology, and Financial, in that order. On the other hand, if you prefer a bullish stance on the market, the model suggests holding Energy, Technology, and Financial, in that order.
IMPORTANT NOTE: I post this information periodically as a free look inside some of our institutional research and as a source of some trading ideas for your own further investigation. It is not intended to be traded directly as a rules-based strategy in a real money portfolio. I am simply showing what a sector rotation model might suggest if a given portfolio was due for a rebalance, and I may or may not update the information each week. There are many ways for a client to trade such a strategy, including monthly or quarterly rebalancing, perhaps with interim adjustments to the bullish/neutral/defensive bias when warranted -- but not necessarily on the days that I happen to post this weekly article. The enhanced strategy seeks higher returns by employing individual stocks (or stock options) that are also highly ranked, but this introduces greater risks and volatility. I do not track performance of the ETF and stock ideas mentioned here as a managed portfolio.
Disclosure: Author has no positions in stocks or ETFs mentioned.
Disclaimer: This newsletter is published solely for informational purposes and is not to be construed as advice or a recommendation to specific individuals. Individuals should take into account their personal financial circumstances in acting on any rankings or stock selections provided by Sabrient. Sabrient makes no representations that the techniques used in its rankings or selections will result in or guarantee profits in trading. Trading involves risk, including possible loss of principal and other losses, and past performance is no indication of future results.