Sector Detector: Stocks finally break out from 3-month rising channel
 Portfolio managers returning from their summer holidays have apparently liked what they’ve heard from the central banks. Although total volume remains modest, U.S. stock indexes have hit new highs. The S&P 500 finally busted out of its 3-month-long bullish rising channel.
First the ECB announced a proposal to support eurozone banks and sovereign debt (which the German constitutional court did not block) that includes unlimited purchases of short-dated government debt. Then the Fed announced its own unlimited plan to soak up $40 billion each month in mortgage-backed bonds, with the stated goal of stimulating job growth—without regard to potential collateral damage. It was all quite good for equities, at least for the moment. Ultimately, this open-ended QE3 will have to produce tangible results in the labor markets.
Almost all sectors are near their highs, demonstrating the strong correlations among equities. Materials has been particularly strong since the stimulus proposals were announced. However, as ConvergEx pointed out this week, this might spell the end of the macro-driven asset performance and high equity correlation of the past five years and usher in the return of the art of stock-picking. If that’s so, it will be a welcome change for many frustrated analysts, traders, and portfolio managers, not to mention quant modelers.
As for the Fed’s new policy of unlimited liquidity, they saw no choice but to unleash the bazooka as the number of Americans on food stamps has risen by 17 million (60%) over the past four years while the number of employed has dropped by 3 million. The ECB intends to “sterilize” their program (by removing from the system the same amount of money that it spends) to limit inflationary pressures, but that does not appear to be the case with Fed’s plan.
There’s no question that the big banks and fat cats who are free to gobble up cheap credit will thrive, but who bears the brunt of the side effects of market manipulation, i.e., who absorbs the collateral damage? Well, we can expect interest rates will remain historically low while the dollar further weakens, which helps U.S. companies who sell overseas since their goods are more affordable in local currencies—at the expense of non-U.S. companies who export products. Those other countries may choose to fight back with their own interventions.
It also will adversely impact fixed income investors, including most retirees, whose interest payments will likely be lower than ever and fall further behind inflation. In the new Fed paradigm, saving is bad and borrowing is good. Treasuries may finally get the boot from investors as rates go from bad to pathetic.
Who might be the winners among stocks is subject to debate, but Apple (AAPL) is wasting no time in steaming ahead since unveiling its new iPhone 5 last Wednesday. Pre-orders topped 2 million units in the first 24 hours and it’s already on delayed delivery. The stock is now above the $700 mark and doing some technical consolidation there.
You know who else has been on a tear is Google (GOOG). Look at a 1-year chart to see the proverbial “hockey stick” pattern, i.e., flat and choppy for an extended period and then straight up. It is now well above $700 and looks like it will soon challenge its all-time highs from 2007 around $747.
Let’s move on to examine the charts. Stimulus from the ECB and the Fed attracted institutional buyers to help the markets make a bullish break through the top of the 3-month-long rising channel. The S&P 500, Dow, Russell 2000, and Nasdaq all hit highs last Friday, but are now consolidating a bit. Only the Nasdaq 100 (QQQ) hit another high on Wednesday, due primarily to heavy weightings in the aforementioned high-fliers AAPL and GOOG.
The S&P 500 SPDR Trust (SPY) closed Wednesday at 146.70. It has been trading within a bullish rising channel since the rally started at the beginning of June, but last Thursday saw a major breakout on the Fed announcement. Friday produced a somewhat bearish Shooting Star candlestick, which has led to some technical consolidation of the uptrend, although the top line of the rising channel has been holding as resistance-turned-support. Price remains well above the 20-, 50-, 100- and 200-day simple moving averages, and in fact it is so far beyond the 20- and 50-day SMAs that a reversion to the mean is likely. Oscillators like RSI, MACD, and Slow Stochastic have mostly flat-lined in overbought territory or are pointing down.
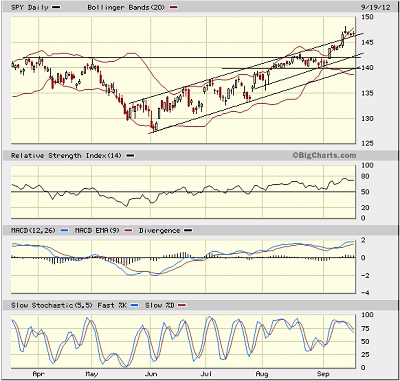
If the top of the rising channel fails to hold as support, there are several interim support levels, including the previous triple-top resistance-turned-support at 142, the convergence at 140 of prior support, the rising 50-day SMA, and the bottom of the rising channel, then the 100-day SMA (near 137), and finally the rising 200-day SMA above 135.
The VIX (CBOE Market Volatility Index—a.k.a. “fear gauge”) closed Wednesday back down at 13.88, which is just above its 52-week low from August and approaching 5-year lows, further reflecting bullish sentiment.
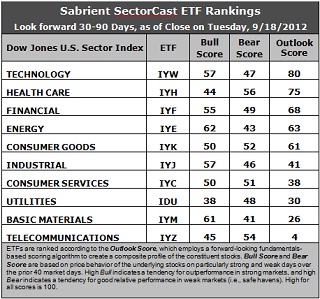
Latest rankings: The table ranks each of the ten U.S. industrial sector iShares (ETFs) by Sabrient’s proprietary Outlook Score, which employs a forward-looking, fundamentals-based, quantitative algorithm to create a bottom-up composite profile of the constituent stocks within the ETF. In addition, the table also shows Sabrient’s proprietary Bull Score and Bear Score for each ETF.
High Bull score indicates that stocks within the ETF have tended recently toward relative outperformance during particularly strong market periods, while a high Bear score indicates that stocks within the ETF have tended to hold up relatively well during particularly weak market periods. Bull and Bear are backward-looking indicators of recent sentiment trend.
As a group, these three scores can be quite helpful for positioning a portfolio for a given set of anticipated market conditions.
Observations:
1. Technology (IYW) remains in the top spot with an Outlook score of 80 yet again. Stocks within IYW are displaying relatively low forward P/Es, strong projected long-term growth, and solid return ratios. However, the analysts have been reducing forward earnings estimates overall. Healthcare (IYH) holds on to the second spot with a 75. Financial (IYF) remains in third at 68, followed by a resurgent Energy (IYE) at 63, and then Consumer Goods (IYK) with a score of 61. Notably, the top five are all solidly above 50, which is bullish.
2. Despite strong price performance, Telecom (IYZ) stays at the bottom of the Outlook rankings this week with an Outlook score of 4. Stocks within the sector are burdened by the highest forward P/Es and the worst return ratios, plus net downgrades from Wall Street. Basic Materials (IYM) falls below Utilities (IDU) into the bottom two as analysts got more aggressive with their earnings downgrades..
3. Overall, I still categorize the rankings as mostly neutral, with conservative sectors like Consumer Goods and Healthcare in the top five, and economically-sensitive sectors like Industrial, Consumer Services, and Basic Materials remain in the bottom five..
4. Looking at the Bull scores, Energy (IYE) is the clear leader on strong market days, scoring 62. Utilities (IDU) is still by far the weakest on strong days, scoring 38. In other words, Energy stocks have tended to perform the best when the market is rallying, while Utilities stocks have lagged.
5. Looking at the Bear scores, Healthcare (IYH) is the investor safe haven on weak market days, scoring 56. Perhaps because there haven’t been many weak days lately, Utilities (IDU) has been scoring surprisingly poorly at 48, whereas just a few weeks ago it was still scoring in the 60s. Basic Materials (IYM) has been abandoned the most by investors during market weakness, as reflected by its low Bear score of 41. In other words, Materials stocks have tended to sell off the most when the market is pulling back, while Healthcare stocks have held up the best.
6. Overall, Technology (IYW) again shows the best all-weather combination of Outlook/Bull/Bear scores. Adding up the three scores gives a total of 184. Telecom (IYZ) is the worst at 103. As for Bull/Bear combination, Energy (IYE) is the best at 105, while Utilities (IDU) is by far the worst with a dismal 86.
These scores represent the view that the Technology and Healthcare sectors may be relatively undervalued overall, while Telecom and Materials sectors may be relatively overvalued based on our 1-3 month forward look.
Top-ranked stocks within IYW and IYH include Google (GOOG), Apple (AAPL), Regeneron Pharmaceuticals (REGN), and Watson Pharmaceuticals (WPI).
Disclosure: Author has no positions in stocks or ETFs mentioned.
About SectorCast: Rankings are based on Sabrient’s SectorCast model, which builds a composite profile of each equity ETF based on bottom-up aggregate scoring of the constituent stocks. The Outlook Score employs a fundamentals-based multi-factor approach considering forward valuation, earnings growth prospects, Wall Street analysts’ consensus revisions, accounting practices, and various return ratios. It has tested to be highly predictive for identifying the best (most undervalued) and worst (most overvalued) sectors, with a 1-3 month forward look.
Bull Score and Bear Score are based on the price behavior of the underlying stocks on particularly strong and weak days during the prior 40 market days. They reflect investor sentiment toward the stocks (on a relative basis) as either aggressive plays or safe havens. So, a high Bull score indicates that stocks within the ETF have tended recently toward relative outperformance during particularly strong market periods, while a high Bear score indicates that stocks within the ETF have tended to hold up relatively well during particularly weak market periods.
Thus, ETFs with high Bull scores generally perform better when the market is hot, ETFs with high Bear scores generally perform better when the market is weak, and ETFs with high Outlook scores generally perform well over time in various market conditions.
Of course, each ETF has a unique set of constituent stocks, so the sectors represented will score differently depending upon which set of ETFs is used. For Sector Detector, I use ten iShares ETFs representing the major U.S. business sectors.
About Trading Strategies: There are various ways to trade these rankings. First, you might run a sector rotation strategy in which you buy long the top 2-4 ETFs from SectorCast-ETF, rebalancing either on a fixed schedule (e.g., monthly or quarterly) or when the rankings change significantly. Another alternative is to enhance a position in the SPDR Trust exchange-traded fund (SPY) depending upon your market bias. If you are bullish on the broad market, you can go long the SPY and enhance it with additional long positions in the top-ranked sector ETFs. Conversely, if you are bearish and short (or buy puts on) the SPY, you could also consider shorting the two lowest-ranked sector ETFs to enhance your short bias.
However, if you prefer not to bet on market direction, you could try a market-neutral, long/short trade—that is, go long (or buy call options on) the top-ranked ETFs and short (or buy put options on) the lowest-ranked ETFs. And here’s a more aggressive strategy to consider: You might trade some of the highest and lowest ranked stocks from within those top and bottom-ranked ETFs.