Sector Detector: Stocks eye new highs as Trump gets busy fulfilling campaign promises
 By Scott Martindale
President, Sabrient Systems LLC
The year has begun with a continuation of the bullish optimism in equities. The new mood rewarding economically-sensitive market segments began with the big post-election rally – which was partly due to simply removing the election uncertainty and partly due to the “Trump Bump” and an expectation of a more business-friendly environment. Investors are playing a bit of wait-and-see regarding President Trump’s initial executive orders. Last week ended with a strong employment report and an executive order seeking to take the shackles off the banking industry (including dismantling of the Dodd-Frank Act and delay/review of the DOL Fiduciary Rule), which sent the Financial sector surging and led the Dow to close back above 20,000 and the NASDAQ Composite to new record highs, while the S&P500 struggles to breakout above the 2,300 level.
No doubt, the new Administration is shaking things up, as promised…and the left is pushing back hard, as promised. Nevertheless, I believe economic fundamentals are positive with a favorable environment for equities globally – especially fundamentals-based portfolios like Sabrient’s. I also like the prospects for small caps, European, and Japan.
In this periodic update, I give my view of the current market environment, offer a technical analysis of the S&P 500 chart, review Sabrient’s weekly fundamentals-based SectorCast rankings of the ten U.S. business sectors, and then offer up some actionable ETF trading ideas. Overall, our sector rankings still look bullish, and the sector rotation model continues to suggest a bullish stance. Read on....
Market overview:
On January 17, we launched our ninth annual Baker’s Dozen top stocks list for 2017. I was on the road continuously over the past four weeks speaking with financial advisors across the country, and they are heartened to see that the investment community seems to have abandoned its short-sighted news-driven trading behavior in favor of a return to normal fundamental-based investing. Today, investors appear to be back in alignment with the expectations of the analyst community, which is more typical behavior. As a result, sector correlations have fallen, dispersion has increased, and small caps are outperforming, meaning that investors are picking their spots rather than engaging in narrow, risk-on/risk-off, fear-based trading.
At Sabrient, we believe in GARP (growth at a reasonable price). After all, that is why someone starts a business or invests in one in the first place, i.e., because they believe that the business will grow its earnings over time. In our view, long-term investing (as opposed to speculation or short-term trading) is all about GARP. Investors never stray from this for very long. And indeed, we already have seen a marked boost in the performance of our portfolios, which are based on our bottom-up, numbers-driven, fundamentals-based, forward-looking quantitative model. At its core, our portfolio construction approach seeks an average Forward PEG (for the next 12 months) that is well under the benchmark.
No doubt, many fundamentals- and valuation-based stock pickers (including virtually all the famous billionaire value investors and activist hedge fund managers) struggled during the unfavorable news-driven risk-on/risk-off market conditions that characterized the June 2015 – June 2016 timeframe, and Sabrient was no exception. But this was essentially one 12-month period of underperformance out of eight years of our Baker’s Dozen publication (starting in 2009) – although admittedly it straddled two of our January Baker’s Dozen portfolios and impacted both.
If Wall Street’s consensus view on the outlook for the companies and industries it covers changes substantially, or if fundamentals are ignored (risk-on/risk-off) by investors, then fundamentals-based strategies like ours languish. This is exactly what happened in mid-2015, when China warned of a falling growth rate and currency devaluation, oil prices fell below key thresholds, the Fed telegraphed commencement of a tightening cycle, and the election campaign rhetoric targeted various industries (especially pharma). At the time, our 2015 Baker’s Dozen was well ahead of the S&P 500 performance.
Market conditions became news-driven rather than fundamentals & valuation-driven and only a handful of mega-cap growth stocks out-performed. Fundamentals simply didn’t matter. Growth greatly outperformed value, and the cap-weighted large cap indexes held up far better than the mid and small caps. But after the short-covering rally in mid-February 2016, the market began to broaden away from its narrow leadership, and after the uncertainties of the Brexit vote and the US elections were lifted later in the year, market behavior began to normalize. Capital flowed heavily into value stocks and small caps, with lower correlations among asset classes and sectors (down from the 95% correlations during 2015, falling into the mid-70s) and higher performance dispersion among equities. This is all quite healthy.
Then, as 2016 began with the worst January in market history, our models indicated that the Wall Street analyst community was indeed optimistic about 2016, but they expected it to be back-half loaded, with the corporate profit recession expected to end in Q3, and this optimism was reflected in our portfolio composition. But for the first half, investors preferred to “wait and see” and remained conservative (even as breadth improved), with top-performing sectors including defensive Utilities, Telecom, and Consumer Staples. It wasn’t until after the Brexit vote and the reality of positive Q3 economic trends that investors got onboard by rotating into Financial, Tech, Materials, and Industrials. This boosted the performance of all Sabrient’s various portfolios, which of course had been positioned for the full-year outlook. In retrospect, investors were unwilling to invest in alignment with the fundamental expectations of Wall Street’s sell-side analyst community’s outlook from June 2015 until June 2016.
Looking ahead, increased personal and corporate spending should continue to stoke the positive trends in correlation and dispersion. Investors will be discerning in picking their spots, and good stock-picking and savvy active managers should have a better opportunity to outperform – notably, just when the financial media has all but counted them out, pronouncing pure-beta passive investing as the “new normal.” Indeed, hundreds of billions of dollars have flowed out of traditional mutual funds and into passive, indexed products. But many, including us at Sabrient, see it differently. For example, Dan Loeb of Third Point LLC wrote in his investor letter that he shifted after the election out of corporate and structured credit and into equities, with a focus on Healthcare, Technology, Industrial, and Financial sectors, plus exposure to Japan.
Moreover, GDP growth has been improving, the corporate “profit recession” has come to an end, capital expenditures are expected to rise with new incentives, and leading economic indicators are strong (and rising), including Purchasing Managers’ Indexes (PMI) in the U.S, China, Japan, Germany, and the Eurozone, which have been ticking up since late last year. Of course, this is bullish for equities. PMI is based on surveys measuring new orders, inventory levels, production, supplier deliveries, and employment – a score over 50 indicates expansion compared to the previous month, while under 50 suggests contraction.
As corporate earnings reports have come out, the big banks have been impressive. They have reported improving interest income and higher trading revenues, as well as higher credit quality – as reserves for bad loans were reduced. Nevertheless, there are still nearly $2 trillion in excess reserves in the banking system, and the M2 money supply is accelerating.
Overall, Q4 earnings reports have shown numerous positive earnings surprises and raised guidance. For the moment, 2017 is expected to see 10% year-over-year earnings growth for the S&P 500, but some commentators are forecasting as much as 20% earnings growth by year end, depending upon how much in the way of fiscal stimulus can be enacted. As I have said quite often, given that P/E multiples on the broad market are at such lofty levels, a prerequisite for continued upside equities will be strong earnings growth, led by top-line growth through capital investment in PP&E and new hires. Lower corporate tax rates and regulatory reform will help boost capital expenditures, and if government-sponsored infrastructure spending materializes, it can provide demand for new equipment from companies in Technology and Industrial sectors. We may be on the verge of a surge in new business formations, and in fact small caps look poised to lead a continued rally, especially given that they are generally less vulnerable to a strong dollar and historically have outperformed during expansionary periods characterized by rising rates and tightening credit spreads.
Although Fed chair Janet Yellen has stated that initiating fiscal stimulus when the economy is at or close to full capacity could be inflationary and have negligible impact on GDP growth, my view is that the economy is not close to full capacity, as demonstrated by Friday’s strong jobs report coupled with an increase in unemployment, as the participation rate rises and the underemployed find jobs in their specialties.
The 10-year Treasury closed Monday at 2.41%, after closing the year at 2.45% (it fell as low as 1.37% back in July). The 30-year closed Monday at 3.05%. On the short end of the yield curve, the 2-year closed at 1.15% and the 5-year closed Monday at 1.85%. The spread between the 10-year and 2-year is 126 bps, while the spread between the 30-year and 5-year is 120 bps. CME fed funds futures place the odds of the next rate hike to occur in March at 9%, 28% in May, and 65% in June (plus a 15% probability of two rate hikes by then). By year end, there is now a 93% chance of at least one hike and a 67% chance of at least two. Nevertheless, rates remain low by historical standards, and we still have an accommodative Fed.
As we approach summer, the year-over-year comps in oil prices and other commodities likely will be less drastic and inflation readings will come under pressure such that it won’t be such a slam-dunk for traders to short 10-year bonds. Similarly, rather than a “great rotation” from bonds into stocks, I think bonds will continue to catch a solid bid whenever the yield inches up, due to all the cheap global cash floating around seeking a safe “carry trade.” I think that both of these dynamics will help keep a lid on longer-term rates, which also bodes well for high-quality dividend-paying stocks.
The CBOE Market Volatility Index (VIX), aka fear gauge, closed Monday at 11.37. After spiking to as high as 23 in advance of the November 8 election, it has closed every day since then securely below the 15 threshold between complacency and fear – which is going on three months.
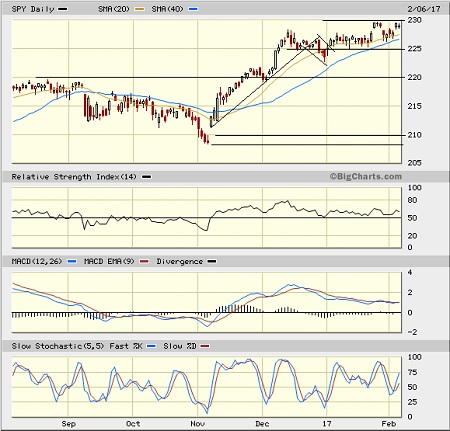
SPY chart review:
The SPY closed Monday at 228.93. The bull flag continuation pattern I identified at the beginning of the year indeed resolved to the upside. Now SPY appears to be in a sideways channel between 225 and 230, with a few minor gaps that might get filled during the consolidation process while awaiting an upside breakout catalyst. However, the 20-day simple moving average has been providing reliable support ever since the election, and so it might continue providing enough support to SPY from testing the bottom of the channel. Time will tell. There is plenty of support below the 20-day SMA, including the 50-day around 226, the bull-flag breakout level at 225, the 100-day SMA now crossing above 220, prior resistance-turned-support at 220, and the critical 200-day down around 216. I don’t think the big post-election gap at 210 will be filled. All of these moving averages are rising, which is bullish. Oscillators RSI, MACD, and Slow Stochastic are all in either neutral or bullish positions. Although Dow 20,000 has been tentatively taken out as resistance, bulls seem to want to continue with their consolidation and testing of conviction before trying to make a major push through 2,300 on the S&P 500 (which is roughly equivalent to SPY at 230). Overall, I continue to like the technical picture.
Latest sector rankings:
Relative sector rankings are based on our proprietary SectorCast model, which builds a composite profile of each of over 600 equity ETFs based on bottom-up aggregate scoring of the constituent stocks. The Outlook Score employs a forward-looking, fundamentals-based multifactor algorithm considering forward valuation, historical and projected earnings growth, the dynamics of Wall Street analysts’ consensus earnings estimates and recent revisions (up or down), quality and sustainability of reported earnings (forensic accounting), and various return ratios. It helps us predict relative performance over the next 1-3 months.
In addition, SectorCast computes a Bull Score and Bear Score for each ETF based on recent price behavior of the constituent stocks on particularly strong and weak market days. High Bull score indicates that stocks within the ETF recently have tended toward relative outperformance when the market is strong, while a high Bear score indicates that stocks within the ETF have tended to hold up relatively well (i.e., safe havens) when the market is weak.
Outlook score is forward-looking while Bull and Bear are backward-looking. As a group, these three scores can be helpful for positioning a portfolio for a given set of anticipated market conditions. Of course, each ETF holds a unique portfolio of stocks and position weights, so the sectors represented will score differently depending upon which set of ETFs is used. We use the iShares that represent the ten major U.S. business sectors: Financial (IYF), Technology (IYW), Industrial (IYJ), Healthcare (IYH), Consumer Goods (IYK), Consumer Services (IYC), Energy (IYE), Basic Materials (IYM), Telecommunications (IYZ), and Utilities (IDU). Whereas the Select Sector SPDRs only contain stocks from the S&P 500, I prefer the iShares for their larger universe and broader diversity.
Here are some of my observations on this week’s scores:
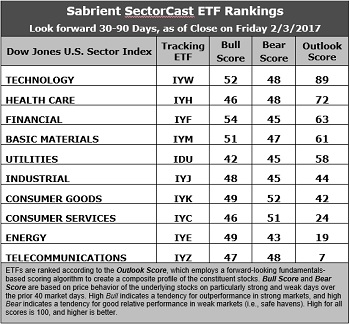
1. Technology retains the top spot with an Outlook score of 89. In aggregate, stocks within the sector display the best Wall Street sell-side analyst sentiment (i.e., net positive revisions to EPS estimates), the highest return ratios, a reasonable forward P/E of about 17.0x, a strong forward long-term EPS growth rate of 13.7%/yr, and the lowest forward PEG of 1.24 (ratio of forward P/E to forward EPS growth rate). Healthcare takes second this week with an Outlook score of 72. Stocks within the sector display by far the lowest forward P/E of 15.2x (as investors avoid the sector given the political rhetoric surrounding it), as well as a solid forward long-term EPS growth rate of 10.2%, a low forward PEG of 1.49, and reasonably solid return ratios. Financial takes the third spot with an Outlook score of 63 and the second lowest forward P/E of 16.7x. Rounding out the top five (all with Outlook scores above 50) are Basic Materials at 61 and Utilities at 58. Note that because of low growth (4.5%/yr), Utilities as the highest forward PEG of 3.87.
2. Telecom and Energy remain in the bottom two with Outlook scores of 7 and 19. Telecom displays the weakest insider and analyst sentiment (i.e., net negative earnings revisions), as well as the second highest forward P/E of 26.4x and the second highest forward PEG of 3.47. Energy has the highest forward P/E of 30.3x and a high forward PEG of 3.34, as well as low return ratios and weakening year-over-year EPS growth comps – although the sector still displays strong sell-side sentiment (net positive EPS revisions). Although Energy stocks in aggregate appear relatively overvalued, Sabrient has found pockets of attractive valuations among some companies in the space.
3. Looking at the Bull scores, Financial boasts the top score of 54 as it recently has displayed relative strength on strong market days, while Utilities is the lowest at 42. The top-bottom spread is 12 points, which reflects moderately high sector correlations on strong market days, which is not as favorable for stock picking. It is desirable in a healthy market to see low correlations reflected in a top-bottom spread of at least 20 points, which indicates that investors have clear preferences in the market segments and stocks they want to hold (rather than broad risk-on behavior).
4. Looking at the Bear scores, we find Consumer Goods (Staples/Noncyclical) at the top with a score of 52, followed closely by Consumer Services (Discretionary/Cyclical), which means that stocks within the sector have been the preferred safe havens lately on weak market days. Energy scores the lowest at 43, as investors have fled during market weakness. The top-bottom spread is only 9 points, which reflects high sector correlations on weak market days. Ideally, certain sectors will hold up relatively well while others are selling off (rather than broad risk-off behavior), so it is desirable in a healthy market to see low correlations reflected in a top-bottom spread of at least 20 points.
5. Technology displays the best all-around combination of Outlook/Bull/Bear scores, while Telecom is the worst. However, looking at just the Bull/Bear combination, Consumer Goods (Staples/Noncyclical) is the highest, followed by Technology, indicating superior relative performance (on average) in extreme market conditions (whether bullish or bearish), while Energy is the worst.
6. This week’s fundamentals-based Outlook rankings still look bullish to me, given that the five of the top six sectors are economically-sensitive (Technology, Healthcare, Financial, Basic Materials, Industrial). Keep in mind, the Outlook Rank does not include timing, momentum, or relative strength factors, but rather reflects the consensus fundamental expectations at a given point in time for individual stocks, aggregated by sector.
ETF Trading Ideas:
Our Sector Rotation model, which appropriately weights Outlook, Bull, and Bear scores in accordance with the overall market’s prevailing trend (bullish, neutral, or defensive), still displays a bullish bias and suggests holding Technology (IYW), Financial (IYF), and Basic Materials (IYM), in that order. (Note: In this model, we consider the bias to be bullish from a rules-based trend-following standpoint when SPY is above both its 50-day and 200-day simple moving averages on the rebalance day.)
Besides iShares’ IYW, IYF, and IYM, other highly-ranked ETFs in our SectorCast model (which scores over 600 US-listed equity ETFs) from the Technology, Financial, and Basic Materials sectors include First Trust NASDAQ-100 Tech Sector Index Fund (QTEC), SPDR S&P Regional Banking (KRE), and John Hancock Multifactor Materials (JHMA).
However, if you prefer a neutral bias, the Sector Rotation model suggests holding Technology, Healthcare, and Financial, in that order. On the other hand, if you are more comfortable with a defensive stance on the market, the model suggests holding Consumer Goods (Staples/Noncyclical), Technology, and Healthcare, in that order.
By the way, an assortment of other unique ETFs that happen to score well in our latest rankings include WBI Tactical SMV Shares (WBIB), Madrona International ETF (FWDI), ALPS Sprott Buzz Social Media Insights (BUZ), Innovator IBD 50 Fund (FFTY), First Trust NASDAQ Rising Dividend Achievers (RDVY), First Trust Dow Jones Select MicroCap Index Fund (FDM), PureFunds ISE Mobile Payments (IPAY), and the Direxion All Cap Insider Sentiment Shares (KNOW), which tracks a Sabrient index.
IMPORTANT NOTE: I post this information periodically as a free look inside some of our institutional research and as a source of some trading ideas for your own further investigation. It is not intended to be traded directly as a rules-based strategy in a real money portfolio. I am simply showing what a sector rotation model might suggest if a given portfolio was due for a rebalance, and I may or may not update the information on a regular schedule. There are many ways for a client to trade such a strategy, including monthly or quarterly rebalancing, perhaps with interim adjustments to the bullish/neutral/defensive bias when warranted, but not necessarily on the days that I happen to post this article. The enhanced strategy seeks higher returns by employing individual stocks (or stock options) that are also highly ranked, but this introduces greater risks and volatility. I do not track performance of the ideas mentioned here as a managed portfolio.
Disclosure: The author has no positions in stocks or ETFs mentioned.
Disclaimer: This newsletter is published solely for informational purposes and is not to be construed as advice or a recommendation to specific individuals. Individuals should take into account their personal financial circumstances in acting on any rankings or stock selections provided by Sabrient. Sabrient makes no representations that the techniques used in its rankings or selections will result in or guarantee profits in trading. Trading involves risk, including possible loss of principal and other losses, and past performance is no indication of future results.