Sector Detector: Sector rankings stay neutral with few bullish catalysts on horizon
 Stocks are hitting new highs across the board, even though earnings reports have been somewhat disappointing. Actually, to be more precise, Q4 results have been pretty good, but it is forward guidance that has been cautious and/or cloudy as sales into overseas markets are expected to suffer due to strength in the US dollar. Healthcare and Telecom have put in the best results overall, while of course Energy has been the weakling. Still, overall year-over-year earnings growth for the S&P 500 during 2015 is expected to be about +8%.
In this weekly update, I give my view of the current market environment, offer a technical analysis of the S&P 500 chart, review our weekly fundamentals-based SectorCast rankings of the ten U.S. business sectors, and then offer up some actionable trading ideas, including a sector rotation strategy using ETFs and an enhanced version using top-ranked stocks from the top-ranked sectors.
Market overview:
Despite cautious earnings guidance and a steady stream of doom-and-gloom in the news from all corners of the globe, the Dow Jones Industrials closed last week above 18,000, while the S&P 500 is pushing for a close above 2100 and the NASDAQ is gunning for 4900. For the week, the Dow gained +1.1%, the S&P 500 +2.0%, and the NASDAQ +3.2%. Furthermore, the S&P 400 Mid caps, the Russell 2000 small caps, and the broad Wilshire 5000 have all achieved new highs, as well. Evidently, U.S. equities remain a relative safe haven for cautious but hungry global investors who have cheap money in their clutches, thanks to global liquidity and currency wars.
Craig Lazzara of S&P Dow Jones Indices penned an article earlier in the month in which he observed that while the S&P 500 total return was -3% in January, the strengthening dollar-versus-euro exchange rate allowed European investors to earn +4% by holding dollar-denominated U.S. equities, as the euro fell -7% against the dollar. So, assuming the dollar continues to generally strengthen against other currencies, the U.S. stands to benefit from global capital flows, even as earnings among multinational U.S. firms encounter headwinds from the same strong dollar. This suggests the potential for near-term expansion in valuation multiples, which is not necessarily desirable. The forward P/E for the S&P 500 is now about 16.5x.
But that is about the only near-term bullish catalyst. Instead, news events and the threat of a sudden Black Swan remain in the forefront of investors’ minds, new highs in stocks notwithstanding. Not the least of which is the steadily metastasizing cancer of radical Islam -- most prominently ISIS, with its Nazi-esque mass brainwashing and barbaric ethnic cleansings. This, along with ongoing issues in places like Greece, Ukraine, China, and Africa (including severe weather here in the U.S.), all contribute to the overall cautious sentiment displayed by investors and analysts alike. High-quality companies with solid business models and conservative accounting practices will reap the benefits.
Although bond yields remain quite low, further supporting the case for equities, U.S. yields have turned upwards. Just this month alone, the 10-year Treasury yield has leapt from a low of 1.67% to 2.04% on Friday (and 2.15% on Monday). The UK’s 10-year closed Friday at 1.71%, the German bund is at 0.36%, Japan is at 0.39%, and Switzerland is yielding a lowly 0.05%. Some are speculating that the time is ripe to begin scaling into floating-rate asset classes.
Last week’s strength in the equity markets led the CBOE Market Volatility Index (VIX), a.k.a. fear gauge, to close Friday at 14.69, which is its first close below 15 this year, reflecting some temporary investor complacency.
SPY chart review:
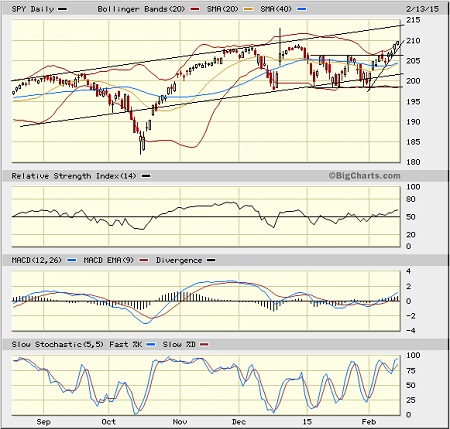
The SPDR S&P 500 Trust (SPY) closed Friday at 209.78 and is making new highs -- albeit just barely and without a resounding, confidence-inducing breakout. SPY price remains above both its 20-day and 50-day simple moving averages. It is in a minor uptrend (as shown in the chart) as it has broken out of the neutral sideways channel that I said last week was still more likely to resolve as a continuation pattern (i.e., bullish). Oscillators RSI and MACD are still pointing up bullishly, but Slow Stochastic remains overbought and needs a consolidation or a slight pullback. Although the chart certainly looks bullish, I still think it is likely that we will get a longer period of consolidation, and perhaps some retesting of support levels, before there is enough conviction to go much higher. Important support levels reside at the 50-day SMA approaching 205, the 100-day SMA and the lower uptrend line, which are both approaching 202, and then the critical 200-day SMA near 198.
Latest sector rankings:
Relative sector rankings are based on our proprietary SectorCast model, which builds a composite profile of each equity ETF based on bottom-up aggregate scoring of the constituent stocks. The Outlook Score employs a forward-looking, fundamentals-based multifactor algorithm considering forward valuation, historical and projected earnings growth, the dynamics of Wall Street analysts’ consensus earnings estimates and recent revisions (up or down), quality and sustainability of reported earnings (forensic accounting), and various return ratios. It helps us predict relative performance over the next 1-3 months.
In addition, SectorCast computes a Bull Score and Bear Score for each ETF based on recent price behavior of the constituent stocks on particularly strong and weak market days. High Bull score indicates that stocks within the ETF recently have tended toward relative outperformance when the market is strong, while a high Bear score indicates that stocks within the ETF have tended to hold up relatively well (i.e., safe havens) when the market is weak.
Outlook score is forward-looking while Bull and Bear are backward-looking. As a group, these three scores can be helpful for positioning a portfolio for a given set of anticipated market conditions. Of course, each ETF holds a unique portfolio of stocks and position weights, so the sectors represented will score differently depending upon which set of ETFs is used. We use the iShares that represent the ten major U.S. business sectors: Financial (IYF), Technology (IYW), Industrial (IYJ), Healthcare (IYH), Consumer Goods (IYK), Consumer Services (IYC), Energy (IYE), Basic Materials (IYM), Telecommunications (IYZ), and Utilities (IDU). Whereas the Select Sector SPDRs only contain stocks from the S&P 500, I prefer the iShares for their larger universe and broader diversity. Fidelity also offers a group of sector ETFs with an even larger number of constituents in each.
Here are some of my observations on this week’s scores:
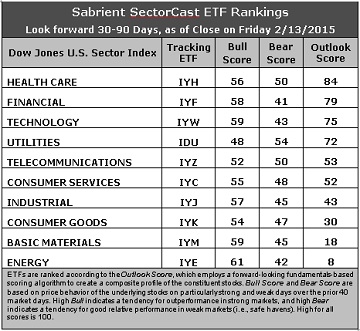
1. The parade of downward revisions to forward earnings estimates from the sell side analyst community continues. Energy continues to take the brunt of it, but all sectors are soundly negative. The three-tier rankings are still in place, but it is notable that Utilities has moved from the second tier to the top tier, joining Healthcare, Financial, and Technology. Healthcare has moved to first place with an Outlook score of 84. It displays the best sentiment among both analysts and insiders, solid return ratios, and a good forward long-term growth rate. Financial takes second place with a score of 79 on the strength of its low forward P/E (despite downward earnings revisions), reasonably good forward long-term growth rate, and strong insider sentiment (buying activity). Technology still displays the best return ratios, a solid forward long-term growth rate, and solid insider sentiment. The Outlook score for Utilities strengthened mainly because of the price underperformance relative to the other sectors. The next tier includes defensive sector Telecom, Consumer Services/Discretionary, and Industrial, whose scores are all bunched around 50. And at the bottom we still see Consumer Goods/Staples, Basic Materials, and Energy.
2. It is no surprise that Energy continues to hold the bottom spot given the persistent weakness in oil prices and the ongoing downward earnings revisions. Energy also shows the worst forward long-term growth rate, the highest (worst) forward P/E, and the worst insider sentiment. Joining Energy in the bottom two again is Basic Materials. Of course, the strength of the dollar is also impacting both sectors.
3. Looking at the Bull scores, Energy displays the top score of 61, followed by Materials and Technology at 59. Utilities scores the lowest at 48. The top-bottom spread is 13 points, which is still somewhat on the low side but better than the tight spreads we were seeing a few weeks ago. It is generally desirable in a healthy market to see low correlations reflected in a top-bottom spread of at least 20 points, which indicates that investors have clear preferences in the stocks they want to hold.
4. Looking at the Bear scores, Utilities displays the highest score of 54 this week, which means that stocks within this sector have been the preferred safe havens on weak market days, although not so clearly preferred as in the past when the Bear score was above 70. Financial has the lowest score of 41, followed closely by Energy. The top-bottom spread is 13 points, which like the Bull scores is somewhat on the low side. Ideally, certain sectors will hold up relatively well while others are selling off. Again, it is generally desirable in a healthy market to see low correlations and a top-bottom spread of at least 20 points.
5. Healthcare displays the best all-around combination of Outlook/Bull/Bear scores, while Energy is the worst. Looking at just the Bull/Bear combination, Healthcare is also the strongest, indicating superior relative performance (on average) in extreme market conditions (whether bullish or bearish), while Financial is the worst.
6. Overall, this week’s fundamentals-based Outlook rankings look even more neutral in my view -- and perhaps even a bit defensive -- as market sentiment continues to grow more cautionary. All-weather sector Healthcare has risen to the top, and the sectors with the strongest Bull scores (Energy and Materials) are at the bottom of the Outlook rankings, while two of the top five sectors are defensive (Utilities and Telecom) with the highest Bear scores. Keep in mind, the Outlook Rank does not include timing or momentum factors, but rather is a reflection of the fundamental expectations of individual stocks aggregated by sector.
Stock and ETF Ideas:
Our Sector Rotation model, which appropriately weights Outlook, Bull, and Bear scores in accordance with the overall market’s prevailing trend (bullish, neutral, or defensive), retains its bullish bias, and the model suggests holding Technology, Financial, and Healthcare, in that order. (Note: In this model, we consider the bias to be bullish from a rules-based trend-following standpoint when SPY is above both its 50-day and 200-day simple moving averages.)
Other highly-ranked ETFs from the Technology, Financial, and Healthcare sectors include First Trust NASDAQ CEA Smartphone Index Fund (FONE), PowerShares KBW Insurance Portfolio (KBWI), and iShares US Healthcare Providers (IHF).
For an enhanced sector portfolio that enlists some top-ranked stocks (instead of ETFs) from within the top-ranked sectors, some long ideas from Technology, Financial, and Healthcare sectors include Marvell Technology Group (MRVL), Avago Technologies (AVGO), The Blackstone Group (BX), Ameriprise Financial (AMP), Acadia Healthcare (ACHC), and MEDNAX (MD). All are highly ranked in the Sabrient Ratings Algorithm.
However, if you prefer to maintain a neutral bias, the Sector Rotation model suggests holding Healthcare, Financial, and Technology, in that order. And if you prefer a defensive stance on the market, the model suggests holding Utilities, Healthcare, and Telecommunications, in that order.
IMPORTANT NOTE: I post this information each week as a free look inside some of our institutional research and as a source of some trading ideas for your own further investigation. It is not intended to be traded directly as a rules-based strategy in a real money portfolio. I am simply showing what a sector rotation model might suggest if a given portfolio was due for a rebalance, and I may or may not update the information each week. There are many ways for a client to trade such a strategy, including monthly or quarterly rebalancing, perhaps with interim adjustments to the bullish/neutral/defensive bias when warranted -- but not necessarily on the days that I happen to post this weekly article. The enhanced strategy seeks higher returns by employing individual stocks (or stock options) that are also highly ranked, but this introduces greater risks and volatility. I do not track performance of the ETF and stock ideas mentioned here as a managed portfolio.
Disclosure: Author has no positions in stocks or ETFs mentioned.
Disclaimer: This newsletter is published solely for informational purposes and is not to be construed as advice or a recommendation to specific individuals. Individuals should take into account their personal financial circumstances in acting on any rankings or stock selections provided by Sabrient. Sabrient makes no representations that the techniques used in its rankings or selections will result in or guarantee profits in trading. Trading involves risk, including possible loss of principal and other losses, and past performance is no indication of future results.