Sector Detector: Q2 earnings season brings anticipation of bullish breakout
 by Scott Martindale
President, Sabrient Systems LLC
From the standpoint of the performance of the broad market indexes, US stocks held up okay over the past four weeks, including a good portion of a volatile June. However, all was not well for cyclicals, emerging markets (including China), and valuation-driven active selection in general, including Sabrient’s GARP (growth at reasonable price) portfolios. Top-scoring cyclical sectors in our models like Financial, Industrial, and Materials took a hit, while defensive sectors (and dividend-paying “bond proxies”) Utilities, Real Estate, Consumer Staples, and Telecom showed relative strength. According to BofA’s Savita Subramanian, “June was a setback for what might have been a record year for active managers.” The culprit? Macro worries in a dreaded news-driven trading environment, given escalating trade tensions, increasing protectionism, diverging monetary policy among central banks, and a strong dollar. But let’s not throw in the towel on active selection just yet. At the end of the day, stock prices are driven by interest rates and earnings, and both remain favorable for higher equity prices and fundamentals-based stock-picking.
Some investors transitioned from a “fear of missing out” at the beginning of the year to a worry that things are now “as good as it gets” … and that it might be all downhill from here. Many bearish commentators expound on how we are in the latter stages of the economic cycle while the bull market in stocks has become “long in the tooth.” But in spite of it all, little has changed with the fundamentally strong outlook underlying our bottom-up quant model, characterized by synchronized global economic growth (albeit a little lower than previously expected), strong US corporate earnings, modest inflation, low global real interest rates, a stable global banking system, and of course historic fiscal stimulus in the US (tax cuts and deregulation), with the US displaying relative favorability for investments. Sabrient’s fundamentals-based GARP model still suggests solid tailwinds for cyclicals, and indeed the start of this week showed some strong comebacks in several of our top picks – not surprising given their lower valuations, e.g., forward P/E and PEG (P/E to EPS growth ratio).
Looking ahead, expectations are high for a big-league 2Q18 earnings reporting season. But the impressive 20% year-over-year EPS growth rate for the S&P 500 is already baked into expectations, so investor focus will be on forward guidance and how much the trade rhetoric will impact corporate investment plans, including capex and hiring. I still don’t think the trade wars will escalate sufficiently to derail the broad economic growth trajectory; there is just too much pain that China and the EU would have to endure at a time when they are both seeking to deleverage without stunting growth. So, we will soon see what the corporate chieftains decide to do, hopefully creating the virtuous circle of supply begetting demand begetting more supply, and so on. Furthermore, the compelling valuations on the underappreciated market segments may be simply too juicy to pass up – unless you believe there’s an imminent recession coming. For my money, I still prefer the good ol’ USA for investing, and I think there is sufficient domestic and global demand for both US fixed income and equities, especially small caps.
In this periodic update, I provide a market commentary, offer my technical analysis of the S&P 500, review Sabrient’s latest fundamentals-based SectorCast rankings of the ten US business sectors, and serve up some actionable ETF trading ideas. In summary, our sector rankings still look bullish, while the sector rotation model has returned to a bullish posture as investors position for a robust Q2 earnings season. Read on....
Market Commentary:
President Trump has wasted little time trying to tackle virtually every campaign promise he made in getting himself elected, like checking off boxes. If you wanted an “anti-politician” to shake things up and make significant “America First” policy changes across the board, you can’t be too disappointed in his actions, including putting more of the productive capital back into private hands, enforcing existing immigration laws, and pushing trade partners to rethink lopsided trade pacts. He certainly has his own nontraditional approach to lighting a fire under the typically slow-motion processes of government and international relations. But for those who prefer statesmanship, globalism, and social progressivism, it must be your worst nightmare. And for investors on both sides, the resulting uncertainty has been unsettling.
But the US is not alone in a move toward populism, nationalism, and a marked change in direction. It has been 10 years since the height of the financial crisis, and even though the world had settled into something of a tranquil state of low economic growth supported by asset inflation from central bank largesse, most of the benefits were going to existing asset owners with ready access to the liquidity spigot. So now Trump has passed historic levels of fiscal stimulus, which suddenly changed the whole global economic state of affairs, and which has given cover to the Fed to continue normalizing rates without upsetting the economy – as well as cover to himself to rattle the cages of our trading partners around the world. The resulting strengthening in the dollar, as the Fed tightens while others hold steady, threatens to raise input costs globally, hurt margins, and increase debt burdens in emerging markets (given that their debts are largely denominated in stronger dollars while their revenues come in various weaker currencies).
As Eric Peters of One River Asset Management has opined, the world is moving from the domination (and predictability) of apolitical global central banks to a populist movement in which the solutions are all different and politically driven, largely driven by extremes in income inequality, the greatest since before the Great Depression. He thinks it simply won’t matter so much anymore what leaders of the central banks (like the Fed chair) have to say. More important now will be politicians and policies related to immigration, trade, and entitlements, and how the next recession will be addressed given that central bank “toolkits” have been largely depleted.
Looking at market performance for the first half of 2018, S&P Global reports that the S&P 500 was +2.6%, led by the Momentum factor at +8.9%, with Value, Quality, and Low-volatility factors bunched together between +0.7% and -2.2%. Mega-cap stocks also outperformed, with narrower market breadth, making the concentration of those mega-caps in the S&P 500 Index their “highest in decades.” S&P Global further points out that since the start of 2017, the S&P 500 Momentum Index has outperformed the benchmark S&P 500 by 15% in total return, and such outperformance usually foretells a reversion to the mean. They also note that high-dividend paying stocks outperformed, with the best performing among their factor indexes during Q2 being the S&P 500 High Dividend Index (which actually is underweight Technology, Momentum, and Growth), which makes some sense in light of the capital flows into fixed income and the fact that the 10-year Treasury yield has become rangebound between 2.8-3.1%.
For the S&P sectors during the first six months of the year, Consumer Discretionary was the leader at +11.5%, followed by Technology at +10.9% and Energy at +6.8%. This sounds like very bullish behavior, except for the fact that other cyclical sectors like Materials, Industrials, and Financials all finished Q2 (YTD) in the red. Notably, the Real Estate sector made huge recovery in June, rising from -10.4% as of the end of May to actually push into positive territory.
According to S&P Dow Jones Indices, S&P 500 Index stock buybacks totaled an all-time high of $189 billion in 1Q18, led by Tech, Healthcare, and Financial sectors, and up 38% versus the previous quarter, 4Q17. The previous high was $172 billion in 3Q07. BofA has estimated that S&P 500 companies will execute buybacks totaling a record $850 billion during 2018. Buybacks are good for valuations as the number of shares (in the denominator of the P/E ratio) are reduced, but the more important indicators of positive corporate sentiment are dividend increases and capital expenditures, which represent investment in the future, so we will see what companies report in this area.
The CBOE Market Volatility Index (VIX), aka “fear gauge,” closed Q2 at 16.09 as volatility has generally returned to a historically normal level. For the past few months it has been trading in a range between 11 and 20, which is elevated compared with last year’s persistent tranquility (average daily close of 11) but still holding below the 20 “panic threshold.” After Monday’s strong market day, the VIX sits at 12.69. There has been much greater volatility in emerging markets, with emerging versus developed market spreads the widest since February 2016. But the strength in US small caps remains encouraging as history tells us that when small caps lead, it is bullish for the broad market.
As for economic reports, things are looking quite strong. The June jobs report showed 213,000 new positions filled, easily beating estimates. Although the unemployment rate ticked up from 3.8% in May to 4.0%, it was due to a rising labor participation rate as people are reentering the workforce and displaying newfound confidence in the economy and job market – and helping to reduce entitlement spending on welfare and food stamps – while average hourly earnings are up 2.7% year-over-year. The FOMC minutes from its June meeting showed an expectation of “a strong labor market to continue to draw individuals into the workforce.” The minutes also indicated a belief among some members that it is “premature to conclude” that recent inflation readings above their 2% target are sustainable, while others worried that letting inflation run could create “financial imbalances that could lead eventually to a significant economic downturn.”
My view is that, although inflation is up a bit, there seems to be little in the way of market forces today to create an inflationary surge. Witness the Phillips curve, the long-accepted inverse relationship between inflation and unemployment, which now seems inadequate in accounting for disinflationary technological disruption and systemic changes to the financial system (e.g., divergent central bank policies). Inflation was widely expected to surge as unemployment dropped below 4.0%, but it simply hasn’t happened.
Chicago PMI came in at 64.1 versus last month's 62.7, with strength in both new orders and unfilled orders. PMI Manufacturing once again came in with another strong month at 55.4. ISM Manufacturing surged to 60.2, with strength in both new orders and backlog, while ISM Non-manufacturing hit a robust 59.1 (although ISM noted “a continuing concern relating to tariffs, capacity constraints and delivery”). Construction Spending has shown a 4.5% year-over-year increase. Consumer Sentiment was strong at 98.2 and remains near record levels, and a survey by the National Association of Manufacturers indicated that 95.1% have a positive outlook for their companies, which NAM said is the highest percentage ever recorded in the survey's 20-year history. In addition, the US Bureau of Economic Analysis (BEA) reported that the goods and services trade deficit declined by 6.5% to $43.1 billion in May, while the Goods trade deficit alone fell -3.8% to $65.8 billion.
As a result, many economists have revised higher their 2Q18 estimates of GDP, with some estimating above 5%. Although the BEA’s final estimate of real GDP growth in 1Q18 came in at only 2.0% (following 2.9% for 4Q2017), the Atlanta Fed’s GDPNow model as of July 6 for 2Q18 forecasts 3.8%, while the New York Fed’s Nowcast model projects 2.8%.
Talk of tariffs and trade war has dampened investor interest in those market segments deemed most vulnerable, particularly emerging markets. But even with some initial tariffs going into effect, the actual numbers are quite low relative to total trade and represent little more than a display of willingness to actually follow through on the verbal threats. I still see it as negotiation posturing. But increasingly, investors are seeing it as brinksmanship that becomes more and more difficult to step away from, and the resulting investor trepidation has held back what should be a broad market advance and has actually depressed equity prices in the more vulnerable market segments, like Materials and Industrials. However, forward valuations have become exceedingly low (and commensurately more attractive).
The poor behavior among Materials and Industrial stocks largely can be attributed to worries about tariffs and trade wars, while Financials are lagging due to a flattening yield curve. Never mind the fact that consensus sell-side EPS estimates continue to be strong in these sectors while tax and regulatory reform have provided powerful tailwinds, forward PEG ratios in each of these sectors have been quite attractive from a GARP standpoint such that Sabrient’s models have strongly favored these sectors. Thus, many of our portfolios were hurt during June, although it has made valuations in those stocks even more attractive. But unless their earnings reports come out sour, with cloudy guidance indicating a “wait-and-see” attitude on capex and hiring until the trade situation is clearer, leading sell-side analysts to cut estimates, the outlook is too strong to be held back – and my expectation is for a solid upside breakout in these underappreciated market segments. Later this week, we will see what some of the big banks have to say, with earnings reports from JPMorgan Chase (JPM), Wells Fargo (WFC), and Citigroup (C), which could move the entire sector.
And it’s not just stocks from Materials, Industrial, and Financial. There are names from across various sectors that have suffered the wrath of the dreaded “headline risk” due to news events. For example, there is Micron Technologies (MU), which has the market position of a juggernaut, but a news story came out about an adverse court ruling in China, and it took a hit. But the company responded that the court ruling will only impact a little more than 1% of sales. Bigger picture, it seems like a relatively small speed bump – given its trailing P/E of 5.4 , forward P/E of 4.7, and forward P/E to Growth ratio (PEG) of 0.24, we think it is greatly undervalued. Moreover, although we don't use price targets in our models, I will note that the consensus sell-side price target is over $80, while trading under $55 today. That indicates nearly 50% potential upside. Others of Sabrient’s recent positions that took a hit in June include diverse names like Caterpillar (CAT), Lam Research (LRCX), Pulte Group (PHM), and Alcoa (AA), but all appear to be underpriced for their long-term EPS growth expectations and continue to score well in our GARP model. Looking specifically at Sabrient’s January 2018 Baker’s Dozen portfolio, upon inception it displayed a forward P/E of 20.3x for 54.4% expected EPS growth for the next 12 months (NTM), or a forward PEG of 0.37. But at the start of this week, the same portfolio displayed forward P/E of 14.9x for 75.4% growth, or a forward PEG of 0.20.
Corporate earnings have been strong so far this year and sell-side analysts have continued to adjust estimates higher across the board. For example, the S&P 500 companies earned about $33 per share in aggregate in 4Q17, according to Bloomberg, but are expected to earn about $42 in 4Q18. For full-year 2018, the estimate is $157 per share. Assuming the 2019 consensus EPS growth remains at 10%, a finish this year around 3,000 on the S&P 500 would suggest a forward P/E of 17.4x, which is not at all unreasonable when you consider the low risk-free rate and how the S&P 500 has evolved into an inherently higher-P/E index, with 26% allocation to the Technology sector and an ever-falling percentage of higher-dividend-paying, lower-P/E defensive names.
I am not a big fan of investing in emerging markets these days as the dollar strengthens. Regarding China’s stock market, it has officially entered a bear market, and the Shanghai Composite has fallen back to where it was in 2006. China is struggling to keep up its rapid growth rate, as its debt-financed growth seemingly requires ever more debt to keep it going. In response, the Chinese government has loosened up on its attempts to tighten credit availability. A trade war could not come at a worse time for China, so I think its government will be unlikely to let the trade war escalate. But here’s the rub. Because the Chinese government still recognizes the critical need for a gradual deleveraging of its economy without stunting economic growth, it seems to have little choice but to let its currency continue to decline, which keeps its exports priced competitively. Worse yet, although a sudden devaluation of the renminbi (a la 2015) would be undesirable for China in its efforts to establish itself as a major player in global financial markets, it is a real risk that would absolutely hurt us here at home – more so than tit-for-tat tariffs. To be sure, things are different today versus 2015 in that China has learned how to better temper volatility in the renminbi; nevertheless, last week it felt the need to intervene in forex market to support its rapidly weakening currency.
Should trade tensions intensify, BofA’s head of foreign exchange strategy David Woo thinks European and emerging market economies will be hurt the most, and their currencies will fall further relative to the US dollar. On the other hand, if trade tensions lessen, Woo thinks our economy will “go crazy” and the dollar will surge due to “a massive repricing of the federal funds rate.”
Japanese 10-Year yields only 0.04% (yes, that’s a measly 4 bps!), Germany yields 0.30%, and UK yields 1.25%, while the US 10-year Treasury closed Monday at 2.86%. Note that even Italy with all its problems pays less (2.67%) than the US. Is it any wonder that there is a solid bid for US Treasuries whenever yields start to creep towards 3%? Besides the attractive relative yield, I would say that global structural issues, aging demographics (creating demand for safe income), total debt levels, political turmoil, the disinflationary impacts of technology, and the strong dollar have created an appetite for the relative safety and higher yields the US offers.
At its June meeting, the FOMC raised interest rates by another 25 bps for its sixth rate hike since December 2015, while signaling it is on track to continue with its plans for normalization. The Fed has pointedly expressed confidence that the economy is sufficiently strong to shoulder higher rates. The current target fed funds rate is 1.75-2.00% (which, by the way, with inflation subtracted is still a slightly negative real rate). CME fed funds futures currently place the odds of 2018’s third rate hike coming at the September meeting at 82%. By the December meeting, there is a 58% probability of a fourth quarter-point rate hike, and a remote 4.3% chance of a fifth hike, but also 42% odds of no action (i.e., a total of only three rate hikes this year).
With the 2-year T-bill at 2.56% and the 10-year Treasury at 2.86%, the closely-watched 2-10 spread sits at only 30 bps – even lower than the 43 bps in the wake of the political turmoil in Italy that threatened the EU. The 2-10 spread continues to decline and is now the tightest it has been since July 2007. Moreover, the term premium (the additional yield investors receive for the extra risk of holding longer-term bonds) remains negative. The Fed thinks that divergent central bank policies may have reduced the term premium on our 10-year Treasury yield by as much as a 100 bps. So, on the one hand, demand for Treasuries is keeping long-term rates in check while the Fed keeps raising on the short-end, thus flattening the yield curve, which is always a bad omen and another source of investor consternation. On the other hand, modest Treasury yields help support higher equity valuations (from the standpoint of both comparable earnings yield and discounted cash flow analysis), which should give equity investors confidence.
JP Morgan expects the Fed to continue its gradual hiking cycle, with the fed funds rate ending the hiking cycle in 12 to 18 months at around 3%. But in my mind, the Fed might have to stop earlier unless some of those aforementioned dynamics give way to rising inflation and higher rates of GDP growth…and higher long-term rates.
Yes, there are plenty of cautionary and/or gloomy voices getting louder and louder these days. But let me reiterate that economic growth has been slow for the past several years, with no boom phase. So why must there be an imminent bust phase – especially when you consider the “stealth busts” we have endured along the way, including a profit recession, capex recession, low inflation, and stagnant wage growth? And as for the bull market in stocks, it’s only “long in the tooth” if you look at the calendar. Instead, consider for a moment that for the past several years stocks have been driven by asset inflation from global QE and a corporate focus on short-sighted but valuation-improving share buyback programs (rather than long-term investments in the future), followed by “multiple expansion” (i.e., rising P/Es) in anticipation of fiscal stimulus. And then today, we finally have fiscal stimulus in the form of corporate tax cuts and regulatory reform such that Corporate America can actually make plans for the future – and indeed we are starting to see the early stages of a boom cycle in capex for expansion, onshoring of operations, M&A, equipment upgrades, and hiring. The only obstacle in our way is confidence among corporate leaders to follow through in the face of new uncertainties of tariffs and trade wars. If they can bring themselves to do so, I think equity investors will follow along.
SPY Chart Review:
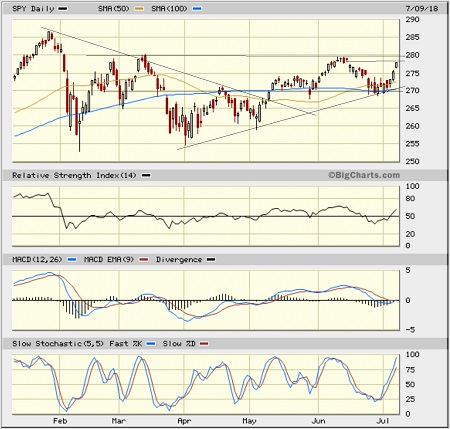
The SPDR S&P 500 ETF (SPY) closed Monday July 9 at 277.90 and appears to be in a sideways trading range between 270 and 280, supported by the 50-day simple moving average (SMA) and with secondary support from the 100-day SMA. I suggested last month that price would likely test resistance at the first “lower high” of the previous downtrend line near 280, which it did, and now that line of resistance is being tested again. Notably, the gap down in mid-June has been filled (as gaps tend to do), and this typically results in a pullback. Oscillators RSI, MACD, and Slow Stochastic are all showing signs of either slowing down or hitting overbought territory, so they likely need a temporary breather (and pullback) before a sustainable breakout attempt. Notably, small caps remain particularly strong, which bolsters the bullish outlook.
Latest Sector Rankings:
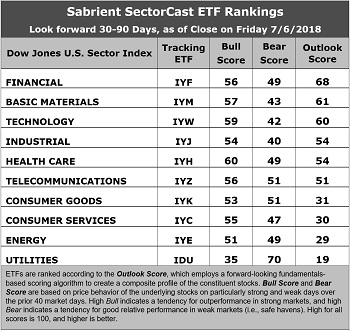
Relative sector rankings are based on our proprietary SectorCast model, which builds a composite profile of each of over 600 equity ETFs based on bottom-up aggregate scoring of the constituent stocks. The Outlook Score employs a forward-looking, fundamentals-based multifactor algorithm considering forward valuation, historical and projected earnings growth, the dynamics of Wall Street analysts’ consensus earnings estimates and recent revisions (up or down), quality and sustainability of reported earnings, and various return ratios. It helps us predict relative performance over the next 1-3 months.
In addition, SectorCast computes a Bull Score and Bear Score for each ETF based on recent price behavior of the constituent stocks on particularly strong and weak market days. A high Bull score indicates that stocks within the ETF recently have tended toward relative outperformance when the market is strong, while a high Bear score indicates that stocks within the ETF have tended to hold up relatively well (i.e., safe havens) when the market is weak.
Outlook score is forward-looking while Bull and Bear are backward-looking. As a group, these three scores can be helpful for positioning a portfolio for a given set of anticipated market conditions. Of course, each ETF holds a unique portfolio of stocks and position weights, so the sectors represented will score differently depending upon which set of ETFs is used. We use the iShares that represent the ten major U.S. business sectors: Financial (IYF), Technology (IYW), Industrial (IYJ), Healthcare (IYH), Consumer Goods (IYK), Consumer Services (IYC), Energy (IYE), Basic Materials (IYM), Telecommunications (IYZ), and Utilities (IDU). Whereas the Select Sector SPDRs only contain stocks from the S&P 500 large cap index, I prefer the iShares for their larger universe and broader diversity.
Here are some of my observations on this week’s scores:
1. Financial has taken the top spot with an Outlook score of 68, displaying the best recent sell-side analyst sentiment (net positive revisions to EPS estimates), a reasonable forward P/E (15.1x), and pretty good projected year-over-year EPS growth rate (14.3%), and a low forward PEG (ratio of forward P/E to forward EPS growth rate) of 1.06. Basic Materials takes second with an Outlook score of 61, having good return ratios, a low forward P/E (14.9x), and a forward PEG of 1.15. Technology is a close third at 60 with the highest return ratios, strong sell-side analyst sentiment, a high projected year-over-year EPS growth rate (15.9%), and a forward PEG (ratio of forward P/E to forward EPS growth rate) of 1.2. Industrial and Healthcare round out the top five. Energy saw the best sell-side analyst sentiment.
2. Utilities again sits at the bottom of the Outlook rankings with a score of 19 as it generally displays poor factor scores across the board, including a low projected EPS growth rate (5.6%) and the highest forward PEG of 3.1. Energy has fallen into the bottom two with a score of 29 despite having the highest projected EPS growth rate (45%) and lowest (most attractive) forward PEG of 0.40.
3. Looking at the Bull scores, Healthcare enjoys the top score of 60, followed closely by Technology at 59, as stocks within these sectors have displayed relative strength on strong market days, while Utilities scores the lowest at 35. The top-bottom spread is 25 points, which reflects low sector correlations on strong market days. It is desirable in a healthy market to see low correlations reflected in a top-bottom spread of at least 20 points, which indicates that investors have clear preferences in the market segments and stocks they want to hold (rather than broad risk-on behavior).
4. Looking at the Bear scores, we find Utilities in the top spot with a score of 70, which means that stocks within this defensive sector have been the preferred safe havens lately on weak market days. Industrial has the lowest score of 40, as investors have fled during recent market weakness. The top-bottom spread is 30 points, which reflects quite low sector correlations on weak market days. Ideally, certain sectors will hold up relatively well while others are selling off (rather than broad risk-off behavior), so it is desirable in a healthy market to see low correlations reflected in a top-bottom spread of at least 20 points.
5. Financial displays the best all-around combination of Outlook/Bull/Bear scores, while Utilities is the worst. Looking at just the Bull/Bear combination, Healthcare is the best, indicating superior relative performance (on average) in extreme market conditions (whether bullish or bearish), while Industrial is by far the worst, as investors have generally avoided the sector.
6. This week’s fundamentals-based Outlook rankings continue to reflect a bullish bias, given that the top five sectors are economically-sensitive or all-weather. Keep in mind, the Outlook Rank does not include timing, momentum, or relative strength factors, but rather reflects the consensus fundamental expectations at a given point in time for individual stocks, aggregated by sector.
ETF Trading Ideas:
Our Sector Rotation model, which appropriately weights Outlook, Bull, and Bear scores in accordance with the overall market’s prevailing trend (bullish, neutral, or defensive), displays a bullish bias and suggests holding Technology (IYW), Healthcare (IYH), and Financial (IYF), in that order – although Basic Materials just barely missed the cut. (Note: In this model, we consider the bias to be bullish from a rules-based trend-following standpoint when SPY is above both its 50-day and 200-day simple moving averages.)
Besides iShares’ IYW, IYH, and IYF, other highly-ranked ETFs in our SectorCast model (which scores nearly 650 US-listed equity ETFs) from the Technology, Healthcare, and Financial sectors include iShares PHLX Semiconductor (SOXX), SPDR S&P Pharmaceuticals (XPH), and First Trust NASDAQ Bank (FTXO).
If you prefer a neutral bias, the Sector Rotation model suggests holding Financial, Basic Materials, and Technology, in that order. On the other hand, if you are more comfortable with a defensive stance on the market, the model suggests holding Utilities, Financial, and Telecom, in that order.
An assortment of other interesting ETFs that are scoring well in our latest rankings include iShares US Home Construction (ITB), Deep Value (DVP), VanEck Vectors Mortgage REIT Income (MORT), First Trust Value Line 100 (FVL), First Trust Dow Jones Select MicroCap (FDM), iShares US Regional Banks (IAT), iShares US Financial Services (IYG), Alpha Architect US Quantitative Value (QVAL), AlphaClone Alternative Alpha (ALFA), Cambria Value and Momentum (VAMO), SPDR MFS Systematic Core Equity (SYE), and VanEck Vectors Steel (SLX).
IMPORTANT NOTE: I post this information periodically as a free look inside some of our institutional research and as a source of some trading ideas for your own further investigation. It is not intended to be traded directly as a rules-based strategy in a real money portfolio. I am simply showing what a sector rotation model might suggest if a given portfolio was due for a rebalance, and I do not update the information on a regular schedule or on technical triggers. There are many ways for a client to trade such a strategy, including monthly or quarterly rebalancing, perhaps with interim adjustments to the bullish/neutral/defensive bias when warranted, but not necessarily on the days that I happen to post this article. The enhanced strategy seeks higher returns by employing individual stocks (or stock options) that are also highly ranked, but this introduces greater risks and volatility. I do not track performance of the ideas mentioned here as a managed portfolio.
Disclosure: The author has no positions in stocks or ETFs mentioned.
Disclaimer: This newsletter is published solely for informational purposes and is not to be construed as advice or a recommendation to specific individuals. Individuals should take into account their personal financial circumstances in acting on any opinions, commentary, rankings, or stock selections provided by Sabrient Systems or its wholly-owned subsidiary Gradient Analytics. Sabrient makes no representations that the techniques used in its rankings or analysis will result in or guarantee profits in trading. Trading involves risk, including possible loss of principal and other losses, and past performance is no indication of future results.