Sector Detector: Positive signals from the economy and stock market
 Needless to say, the news headlines have been dominated by the ongoing saga of President Obama posturing against Syrian dictator Assad and his chemical weapons arsenal. Who’d have thought that Russia would emerge as the cool head in the mix? They must be basking in the limelight -- an unfamiliar role for them. I think we can all agree that any solution that doesn’t involve death, destruction, millions of dollars, and years of nation-building is most welcome. Indeed, investors seem to be willing to bet on a non-violent outcome, as markets have turned quite positive.
Although last Friday’s jobs report was a disappointment, investors seem to be looking ahead as they should. Thus, while interest rates rise, we have seen low-debt tech companies hitting 52-week highs, and cyclical sectors showing bullish leadership. Social media, biotech, and solar have demonstrated particularly impressive strength.
Furthermore, the important Dow Jones Transportation Average is acting quite well. In fact, nine of the ten U.S. sector iShares, with the exception of yield-oriented Utilities (IDU), are now at or above their 50-day SMAs, with the biggest moves over the past month in economically-sensitive sectors Materials, Energy, and Industrial.
Notably, the iShares MSCI Emerging Markets ETF (EEM), which was so beaten down while the U.S. markets have partied on, has been on a roll for the past few weeks. It now sits well above its 50-day SMA and is challenging resistance at its 200-day. However, its underperformance has been so dramatic that the recent rally may simply be some overdue mean reversion.
On the other hand, with interest rates climbing to 2-year highs, defensive and interest-rate-sensitive sectors like Consumer Staples, Utilities, and Real Estate have all weakened in the face of rising interest rates.
All in all, the signs point to a growing economy, and the Fed is taking note. The next FOMC meeting is next week, and although they might choose to delay the start of tapering until December given the global uncertainties at hand, that may put it uncomfortably close to holiday season and the end of Chairman Bernanke’s term. My guess is that a modest reduction in the size of the monthly bond purchases will be announced next week, along with a reiteration that they will not be abandoning the economy with a wholesale exit during this tepid recovery.
The SPY closed Wednesday at 169.40, and is acting like it really wants to challenge its highs. It has gone virtually straight up since finding support at its 100-day simple moving average and the uptrend line from late June’s bullish reversal. Last Wednesday provided a breakout above a neutral symmetrical triangle formation, and boy did it ever confirm in a hurry, with just a brief retest during Friday’s turbulence. Oscillators RSI, MACD, and Slow Stochastic have all recovered from oversold territory and might be ready for a breather as SPY approaches resistance, but they could easily run further, too.
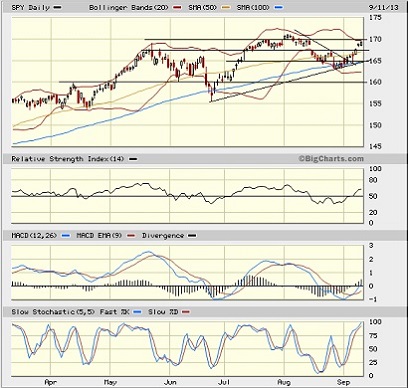
I suggested last week that a continued bounce could take SPY up to fill the price gap down from mid-August, and perhaps retest resistance at 170. Indeed, the gap was filled, and now SPY is testing resistance at 170. It is possible that the price gap up from Monday’s close might get filled back down around 167.60, but I think that would be the extent of any immediate pullback from here…unless of course an ominous news event takes control.
The CBOE Market Volatility Index (VIX), a.k.a. “fear gauge,” closed Wednesday at 13.82, confirming its move below the 15 threshold, which is low by historical standards.
It is also worth noting that asset class correlations appear to be dropping, most likely due to the imminent Fed tapering. Take a look at the charts of the various market indexes since mid-July. We should expect to see less in the way of “risk-on/risk-off, all-boat-lifted/all-boats-fallen” trading and more in the way of fundamental asset allocation and stock-picking. That would be a good thing, particularly after more than four years of Fed stimulus and the associated market distortions.
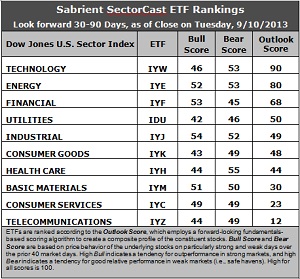
Latest rankings: The table ranks each of the ten U.S. business sector iShares ETFs by Sabrient's proprietary Outlook Score, which employs a forward-looking, fundamentals-based, quantitative algorithm to create a bottom-up composite profile of the constituent stocks within the ETF. The multi-factor model considers forward valuation, historical earnings trends, earnings growth prospects, the dynamics of Wall Street analysts' consensus estimates, accounting practices and earnings quality, and various return ratios. In addition, the table also shows Sabrient's proprietary Bull Score and Bear Score for each ETF.
High Bull score indicates that stocks within the ETF have tended recently toward relative outperformance during particularly strong market periods, while a high Bear score indicates that stocks within the ETF have tended to hold up relatively well during particularly weak market periods. Bull and Bear are backward-looking indicators of recent sentiment trend.
As a group, these three scores can be quite helpful for positioning a portfolio for a given set of anticipated market conditions.
Observations:
1. Technology (IYW) remains in the top spot with a robust Outlook score of 90. IYW displays a low forward P/E, a solid projected long-term growth rate, and the best return ratios. Its only weakness is underwhelming sentiment among both Wall Street analysts and insiders. Energy (IYE) continues to see its Outlook score rise as it takes sole possession of second place this week with a score of 80. IYE displays the lowest forward P/E and solid return ratios, but also suffers from weak sentiment among analysts and insiders. Rounding out the top five are Financial (IYF), Utilities (IDU), and Industrial (IYJ).
2. Notably, the Outlook score for IDU has benefited from its poor price performance, which has driven down its forward P/E, as yield-hungry investors may be looking to rising interest rates as a source of income. In fact, its Bull score has fallen from 54 a couple of weeks ago to just 42 this week, which shows that Utilities stocks have not participated in the latest market rally.
3. Telecom (IYZ) is in the cellar yet again with an Outlook score of 12, but this is notably higher than it has been in a while, as sentiment has improved among Wall Street analysts and insiders. Still, IYZ remains weak in most factors across the board, including a high forward P/E, low return ratios, and modest projected long-term growth. Staying in the bottom two this week is Consumer Services (IYC)) with a score of 23, due to relative poor analyst sentiment in the form of net downgrades to earnings estimates and a high forward P/E, although its projected long-term growth rate is still the highest.
4. This week’s fundamentals-based rankings maintain their bullish bias as the four of the five highest-ranked sectors are all economically sensitive -- Technology, Energy, Financial, and Industrial.
5. Looking at the Bull scores, Industrial (IYJ) has been the leader on particularly strong market days, scoring 54, while Utilities (IDU) scores the lowest at 42. It’s notable that Technology (IYW) continues to show a modest Bull score and a propensity to lag on strongly bullish days.
6. Looking at the Bear scores, Healthcare (IYH) is the favorite “safe haven” on weak market days, scoring 55, while Financial (IYF) is the lowest at 45. The top-bottom spread is a narrow 10 points, and 7 of the 10 are bunched in the range of 49-53, all of which indicates relatively high sector correlations on particularly weak market days, i.e., across-the-board selling during extreme market weakness.
7. Overall, IYW shows the best all-weather combination of Outlook/Bull/Bear scores. Adding up the three scores gives a total of 189. IYZ is the by far the worst at 105. Looking at just the Bull/Bear combination, IYJ displays the highest score of 106 this week, followed closely by IYE, which indicates good relative performance in extreme market conditions (whether bullish or bearish), while IDU is by far the lowest at an anemic 88, which indicates pervasive investor avoidance during extreme conditions.
These Outlook scores represent the view that Technology and Energy sectors are still relatively undervalued, while Telecom and Consumer Services may be relatively overvalued based on our 1-3 month forward look.
Some top-ranked stocks within IYW and IYE that look good to me this week include VMware (VMW), SanDisk (SNDK), Chart Industries (GTLS), and SM Energy (SM).
Furthermore, I was recently interviewed for an IBD article on top ETFs for the remainder of 2013 in which I suggested the First Trust NASDAQ Technology Dividend Fund (TDIV).
And don’t forget, Sabrient’s annual Baker’s Dozen portfolio of top stocks for 2013 continues to outperform by a wide margin. It is now up +30.4% from the portfolio’s inception on January 11, more than doubling the S&P 500 return of +14.7% over the same timeframe. In fact, all 13 stocks are comfortably positive, led by Jazz Pharmaceuticals (JAZZ), Genworth Financial (GNW), EPL Oil & Gas (EPL), and Ocwen Financial (OCN). (Note: last year’s portfolio was up +43%.)
Disclosure: Author has no positions in stocks or ETFs mentioned.
About SectorCast: Rankings are based on Sabrient’s SectorCast model, which builds a composite profile of each equity ETF based on bottom-up aggregate scoring of the constituent stocks. The Outlook Score employs a fundamentals-based multi-factor approach considering forward valuation, earnings growth prospects, Wall Street analysts’ consensus revisions, accounting practices, and various return ratios. It has tested to be highly predictive for identifying the best (most undervalued) and worst (most overvalued) sectors, with a 1-3 month forward look.
Bull Score and Bear Score are based on the price behavior of the underlying stocks on particularly strong and weak days during the prior 40 market days. They reflect investor sentiment toward the stocks (on a relative basis) as either aggressive plays or safe havens. So, a high Bull score indicates that stocks within the ETF have tended recently toward relative outperformance during particularly strong market periods, while a high Bear score indicates that stocks within the ETF have tended to hold up relatively well during particularly weak market periods.
Thus, ETFs with high Bull scores generally perform better when the market is hot, ETFs with high Bear scores generally perform better when the market is weak, and ETFs with high Outlook scores generally perform well over time in various market conditions.
Of course, each ETF has a unique set of constituent stocks, so the sectors represented will score differently depending upon which set of ETFs is used. For Sector Detector, I use ten iShares ETFs representing the major U.S. business sectors.
About Trading Strategies: There are various ways to trade these rankings. First, you might run a sector rotation strategy in which you buy long the top 2-4 ETFs from SectorCast-ETF, rebalancing either on a fixed schedule (e.g., monthly or quarterly) or when the rankings change significantly. Another alternative is to enhance a position in the SPDR Trust exchange-traded fund (SPY) depending upon your market bias. If you are bullish on the broad market, you can go long the SPY and enhance it with additional long positions in the top-ranked sector ETFs. Conversely, if you are bearish and short (or buy puts on) the SPY, you could also consider shorting the two lowest-ranked sector ETFs to enhance your short bias.
However, if you prefer not to bet on market direction, you could try a market-neutral, long/short trade—that is, go long (or buy call options on) the top-ranked ETFs and short (or buy put options on) the lowest-ranked ETFs. And here’s a more aggressive strategy to consider: You might trade some of the highest and lowest ranked stocks from within those top and bottom-ranked ETFs.