Sector Detector: New Year brings new hope after bulls lose traction to close 2015
The S&P 500 large caps closed 2015 essentially flat on a total return basis, while the NASDAQ 100 showed a little better performance at +8.3% and the Russell 2000 small caps fell -5.9%. Overall, stocks disappointed even in the face of modest expectations, especially the small caps as market leadership was mostly limited to a handful of large and mega-cap darlings. Notably, the full year chart for the S&P 500 looks very much like 2011. It got off to a good start, drifted sideways for a few months, threw everyone into a tizzy with a scary summer correction, found double-bottom support leading to a strong October rally, and then fell into a sideways consolidation for the last two months of the year. It’s like deja vu. In both years, a sideways channel set the trading range most of the time, and without a strong catalyst, there simply wasn’t enough fuel to ignite a major breakout for either the bulls or the bears.
In contrast to 2015 ending as it did with a whimper, the first trading day of 2016 was downright scary (the worst opening day for the Dow Industrials in eight years) -- as if to give fair warning of a more volatile year ahead. But higher volatility wouldn’t necessarily be a bad thing, as investors and corporations may be more inclined to allocate capital with an eye toward risk exposures, i.e., a flight to quality, including value, GARP (growth at a reasonable price), and dividend-paying stocks. We just might end up looking back on 2015 as a cautious year of transition out of the ZIRP era.
In this weekly update, I give my view of the current market environment, offer a technical analysis of the S&P 500 chart, review our weekly fundamentals-based SectorCast rankings of the ten U.S. business sectors, and then offer up some actionable trading ideas, including a sector rotation strategy using ETFs and an enhanced version using top-ranked stocks from the top-ranked sectors.
Market overview:
Yes, U.S. stocks mostly disappointed investors last year, although few market commentators at the beginning of the year were expecting much in the way of returns for the stock market to begin with -- perhaps at best seeing prices move up in proportion to aggregate earnings growth. But aggregate earnings growth didn’t materialize, thanks mainly to the dismal performance of the Energy sector.
From a global perspective, the top performing countries (measured in constant US dollars) last year were Hungary +30%, Denmark +22%, and Ireland +17% -- and all rose much higher when measured in their local currencies as the dollar strengthened considerably against almost all other currencies. For example, Hungary was up +44% in its local currency (forint). On the bottom of the stack, the worst performers were Colombia -45%, Brazil -42%, Turkey -33%, and Greece -31% (measured in US dollars). Looking at our neighbors, Canada fell -25% in US dollars (-11% in CDN dollars) and Mexico fell -15% (but it was flat when priced in pesos).
But if you were focused on the U.S., it was tough to find anything that worked in the way of liquid asset allocation/rotation. In fact, 2015 was one of the worst for asset allocation strategies in several decades, as stocks, bonds, commodities, and cash all lost money. Seven years of ZIRP monetary policy helped inflate stocks, Treasuries, and high-yield bonds, and there was simply nowhere to find refuge once the Fed made it clear that the first step toward interest rate normalization was nigh. Most years offer up at least one asset class for superior returns, usually exceeding 10%. And indeed many of the biggest names in the business had a miserable year, from Warren Buffett’s deep value approach to David Einhorn’s long/short activist strategy.
It was a year of narrow market breadth, particularly after small caps hit their peak on June 23. To illustrate, just look at the performance difference of the cap-weighted SPDR S&P 500 Trust (SPY) versus the equal-weighted Guggenheim Russell 2000 Equal Weight ETF (EWRS). Since June 23, SPY fell -3.2% through December 31 while EWRS fell -15.2%. That’s a whopping 12% performance differential.
One of the drivers of this was the growth in money flows into passive index funds, which have a far different and simplistic approach to stock selection compared to the careful analysis of active management. During 2015, approximately $150 billion flowed into passive index funds while roughly the same amount was flowing out of actively managed mutual funds. Moreover, if you weren’t in the handful of large-cap investor darlings, particularly the so-called FANG stocks (Facebook, Amazon, Netflix, Google), your portfolio likely struggled. The four FANG stocks alone boosted the S&P 500 overall performance by +2%, with Netflix (NFLX) and Amazon.com (AMZN) each more than doubling.
Negatives weighing on growth in GDP and corporate revenue and earnings were the strong dollar, slowing growth in China, divergent monetary policies between the US and the other central banks, the implosion of oil prices and by extension all commodities, and geopolitical risks popping up from all directions (the latest is the collapse of diplomatic relations between Iran and Saudi Arabia). Also, there was the new and unnerving face of Islamic terrorism in several forms, from the barbaric ISIS and its goal of a fundamentalist caliphate, to the radicalized young couple living quietly on Main Street, quietly building an arsenal before unleashing their wrath.
The CBOE Market Volatility Index (VIX), a.k.a. fear gauge, closed the year at 18.21, which is still above the 15 fear threshold but well below the 20 panic threshold. However, Monday’s big selloff to start the New Year pushed VIX above 23 intraday before closing at 20.70. Indeed, many commentators are warning of a new normal when it comes to volatility during 2016.
But again, this isn’t necessarily bad if it helps engender a renewed appreciation for high-quality value, GARP (growth at a reasonable price), and dividend-paying stocks. Furthermore, with some uncertainty removed in the form of the Fed’s tightening cycle, and a display of strength and resolve in the face of terrorism, 2016 may be a year for risk assets like equities to once again gain some traction -- but don’t bank on the high-flying FANG stocks leading the way this time around.
The damage in the Energy sector from oil prices falling so much further than any analyst’s model projected pushed the aggregate S&P 500 earnings numbers into negative territory for 2015, which masked strengths in other areas of the economy. Energy contributed a dismal -59% year-over-year EPS growth, while Materials sector earnings were down -7.4% and Industrial down -0.7%. But there were EPS winners such as Telecom, Financials, Healthcare, and Consumer Discretionary. Looking at the upcoming earnings reports for Q4 alone, S&P 500 companies are expected to post -5.3% EPS growth according to S&P Capital IQ, although if you strip out Energy it would be slightly positive. Alcoa (AA) officially kicks things off next Monday.
For 2016, consensus EPS estimates for the S&P 500 is +7.8%, which is expected to be helped along by a stabilization in Energy and improvement in Materials, plus strength in Consumer Discretionary, Healthcare, Financial, and Technology. Financial is sure be a key sector to watch. As we enter the New Year, Financial is among the top ranked sectors in our fundamentals-based SectorCast rankings as described below, and with their 17% weighting in the S&P 500, leadership from this sector is important to market performance this year.
Let’s discuss equity valuations. Before the August sell-off, the S&P 500 traded at 16.6x forward earnings versus a 10-year average of 14.1x. With an expectation for $120 in 2015 EPS, the year-end close at 2044 gives an earnings yield of 5.9%. Adding a typical 3% risk premium over the 10-year Treasury yield of 2.27% implies a fair value of 5.3% earnings yield, so stocks are still undervalued on a trailing basis. The key will be EPS growth this year, which will need to be spurred by some top-line growth rather than productivity improvements, cost-cutting, and share buyback programs that have been driving corporate earnings.
There certainly are plenty of negatives building a wall of worry, ranging from a persistently strong dollar to economic collapse in Brazil to building tensions between Russia and the West (exacerbated by the latest Iran/Saudia Arabia conflict). In spite of FOMC comments and dot plots, economic growth forecasts around the world are unlikely to support the case for further rate hikes. But whether or not the Fed pushes ahead and hikes twice in 2016 as projected, high-quality dividend-paying stocks seem attractive. Moreover, value investing might make a comeback this year, given elevated multiples.
We at Sabrient are in the process of making the final selections for our eighth annual Baker’s Dozen top picks for the New Year, I am looking forward to being on the road for pretty much the entire month of January and the beginning of February, speaking with financial advisors across the country. When I am in Florida in late January, I am excited to take part in the Inside ETFs 2016 conference in Hollywood, FL on January 24-27. ETF.com has provided me with a discount code to share with advisors who might want to attend: IE16-SM. I hope to see you there.
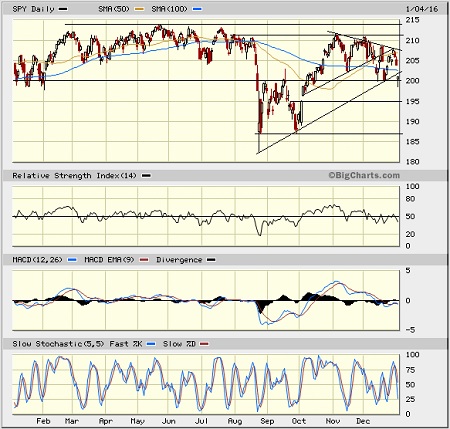
SPY chart review:
The SPDR S&P 500 Trust (SPY) closed the year at 203.87. The full year chart looks very much like 2011. As you recall, 2011 started strong, traded sideways for a few month, took a big dive in August and then recovered strongly in October before settling into a sideways consolidation pattern for the rest of the year. Will we get a similarly strong year to 2012 as a follow up next year? SPY finished 2015 below its 50-day and 200-day simple moving averages (which have converged together at about 207) after failing at resistance at that level. There are possible rising uptrend lines that could eventually form into a bullish ascending triangle, with either the 211 or 214 levels as resistance. And there seems to be a symmetrical triangle formation with lower highs and higher lows, as shown. Round-number support at 200 followed by 195 could be the bottoms of the sideways channel, and then lower support comes in at the August-September lows around 187.5. Oscillators RSI, MACD, and Slow Stochastic all seem to be in neutral positions to go either way. More downside action after the year-end chart configuration seemed likely, and indeed Monday provided a big bearish gap down to below support at 200, but by the close the 200 level was strongly recaptured, and bullish hammer candlestick was formed. Price remains within the sideways channel between 200 and 211, and may soon head higher to retest resistance levels at 207 (50-day SMA) and 211, but bears will be trying to fill the bullish gap down around 195. Overall, price should eventually resolve to the upside.
Latest sector rankings:
Relative sector rankings are based on our proprietary SectorCast model, which builds a composite profile of each equity ETF based on bottom-up aggregate scoring of the constituent stocks. The Outlook Score employs a forward-looking, fundamentals-based multifactor algorithm considering forward valuation, historical and projected earnings growth, the dynamics of Wall Street analysts’ consensus earnings estimates and recent revisions (up or down), quality and sustainability of reported earnings (forensic accounting), and various return ratios. It helps us predict relative performance over the next 1-3 months.
In addition, SectorCast computes a Bull Score and Bear Score for each ETF based on recent price behavior of the constituent stocks on particularly strong and weak market days. High Bull score indicates that stocks within the ETF recently have tended toward relative outperformance when the market is strong, while a high Bear score indicates that stocks within the ETF have tended to hold up relatively well (i.e., safe havens) when the market is weak.
Outlook score is forward-looking while Bull and Bear are backward-looking. As a group, these three scores can be helpful for positioning a portfolio for a given set of anticipated market conditions. Of course, each ETF holds a unique portfolio of stocks and position weights, so the sectors represented will score differently depending upon which set of ETFs is used. We use the iShares that represent the ten major U.S. business sectors: Financial (IYF), Technology (IYW), Industrial (IYJ), Healthcare (IYH), Consumer Goods (IYK), Consumer Services (IYC), Energy (IYE), Basic Materials (IYM), Telecommunications (IYZ), and Utilities (IDU). Whereas the Select Sector SPDRs only contain stocks from the S&P 500, I prefer the iShares for their larger universe and broader diversity. Fidelity also offers a group of sector ETFs with an even larger number of constituents in each.
Here are some of my observations on this week’s scores:
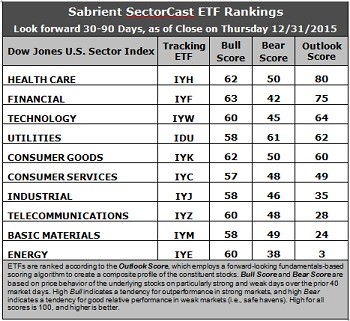
1. Financial slip to the second spot this week with an Outlook score of 75. Healthcare is back on top with an 80. The sector has reasonably good factor scores across the board, and in particular has the best sentiment among Wall Street sell-side analysts as its aggregate net revisions to earnings estimates has turned positive, while all other sectors remain at least slightly negative. Financial also has reasonably good factor scores across the board, and in particular has the lowest forward P/E (14.7x). Technology takes third at 64 and displays the highest forward long-term growth rate. Utilities and Consumer Goods (Staples/Noncyclical) round out the top five, followed by Consumer Services (Discretionary/Cyclical) and Industrial (which includes the strong Airlines industry).
2. Energy remains at the bottom with an Outlook score of 3 as the sector scores the absolute worst in all factors of the GARP model this week. In particular, stocks within the sector still show a significantly negative forward long-term growth rate, the worst sell-side earnings revisions, and low return ratios, as well as the highest forward P/E (around 22.3x). Basic Materials shares the other spot in the bottom two with an Outlook score of 24, as commodities and materials prices continue to languish.
3. Looking at the Bull scores, Financial tops the list with a 62, followed closely by Healthcare and Consumer Goods (Staples/Noncyclical), while Consumer Services (Discretionary/Cyclical) is the lowest at 57. The top-bottom spread is only a meager 5 points, which reflects very high sector correlations on strong market days, which is not so good for stock picking. It is generally desirable in a healthy market to see low correlations reflected in a top-bottom spread of at least 20 points, which indicates that investors have clear preferences in the stocks they want to hold (rather than broad risk-on behavior).
4. Looking at the Bear scores, Utilities displays the top score of 61, which means that stocks within this sector have been the preferred safe havens (relatively speaking) on weak market days. Energy scores the lowest at 38 as investors flee during market weakness. The top-bottom spread is 23 points, which reflects low sector correlations on weak market days, which is good for stock picking. Ideally, certain sectors will hold up relatively well while others are selling off (rather than broad risk-off behavior), so it is generally desirable in a healthy market to see low correlations reflected in a top-bottom spread of at least 20 points.
5. Healthcare displays the best all-around combination of Outlook/Bull/Bear scores, followed by Financial, while Energy is by far the worst. However, looking at just the Bull/Bear combination, Utilities is the best, indicating superior relative performance (on average) in extreme market conditions (whether bullish or bearish), while Energy again is the worst.
6. This week’s fundamentals-based Outlook rankings still look mostly neutral. Healthcare at the top is somewhat all-weather (so it’s not a strong indicator either way of bullish or defensive sentiment), followed by economically sensitive sectors Financial and Technology, which is bullish, followed by defensive sectors Utilities and Consumer Goods (Staples/Noncyclical), which tempers the bullish sentiment. Economically sensitive Consumer Services (Discretionary/Cyclical) and Industrial are next on the list and scoring a little higher this week, so perhaps the rankings are showing a glimmer of bullish tilt. Keep in mind, the Outlook Rank does not include timing, momentum, or relative strength factors, but rather is a reflection of the fundamental expectations of individual stocks aggregated by sector.
Stock and ETF Ideas:
Our Sector Rotation model, which appropriately weights Outlook, Bull, and Bear scores in accordance with the overall market’s prevailing trend (bullish, neutral, or defensive), reflects a defensive bias and suggests holding Utilities, Healthcare, and Consumer Goods (Staples/Noncyclical), in that order. (Note: In this model, we consider the bias to be defensive from a rules-based trend-following standpoint when SPY is below both its 50-day and 200-day simple moving averages.)
Other highly-ranked ETFs in SectorCast from the Utilities, Healthcare, and Consumer Goods (Staples/Noncyclical) sectors include Guggenheim Invest S&P 500 Equal Weight Utilities ETF (RYU), Health Care Select Sector SPDR Fund (XLV), and PowerShares DWA Consumer Staples Momentum Portfolio (PSL). Other notable ETFs that are highly ranked in our quant model include US Global Jets ETF (JETS), which is mostly airlines, PowerShares Dynamic Leisure & Entertainment Portfolio (PEJ), Arrow QVM Equity Factor ETF (QVM), the Direxion All Cap Insider Sentiment Shares (KNOW), which tracks a Sabrient index, and some dividend-paying funds, including the Global X SuperDividend REIT ETF (SRET) and the Global X SuperDividend US ETF (DIV).
For an enhanced sector portfolio that enlists some top-ranked stocks (instead of ETFs) from within the top-ranked sectors, some long ideas from Utilities, Healthcare, and Consumer Goods (Staples/Noncyclical) sectors include NextEra Energy (NEE), NRG Energy (NRG), Intuitive Surgical (ISRG), Regeneron Pharmaceuticals (REGN), The Clorox Company (CLX), and Dr Pepper Snapple Group (DPS). All are highly ranked in the Sabrient Ratings Algorithm.
If you prefer to take a neutral bias, the Sector Rotation model suggests holding Healthcare, Financial, and Technology, in that order. On the other hand, if you prefer a bullish stance on the market, the model suggests holding Financial, Healthcare, and Consumer Goods (Staples/Noncyclical), in that order.
IMPORTANT NOTE: I post this information periodically as a free look inside some of our institutional research and as a source of some trading ideas for your own further investigation. It is not intended to be traded directly as a rules-based strategy in a real money portfolio. I am simply showing what a sector rotation model might suggest if a given portfolio was due for a rebalance, and I may or may not update the information each week. There are many ways for a client to trade such a strategy, including monthly or quarterly rebalancing, perhaps with interim adjustments to the bullish/neutral/defensive bias when warranted -- but not necessarily on the days that I happen to post this weekly article. The enhanced strategy seeks higher returns by employing individual stocks (or stock options) that are also highly ranked, but this introduces greater risks and volatility. I do not track performance of the ETF and stock ideas mentioned here as a managed portfolio.
Disclosure: Author has no positions in stocks or ETFs mentioned.
Disclaimer: This newsletter is published solely for informational purposes and is not to be construed as advice or a recommendation to specific individuals. Individuals should take into account their personal financial circumstances in acting on any rankings or stock selections provided by Sabrient. Sabrient makes no representations that the techniques used in its rankings or selections will result in or guarantee profits in trading. Trading involves risk, including possible loss of principal and other losses, and past performance is no indication of future results.