Sector Detector: How to avoid stock meltdowns while the market melts up
 As I and most other observers expected, stocks took the go-signal from Congress and burst through all prior resistance levels with barely any hesitation. And why not? Central banks are keeping the liquidity flowing for the foreseeable future, corporate earnings are at record highs, cash coffers are full, M&A activity is brisk, the economic data is generally positive, multiple expansion is not yet out of whack (relative to investment alternatives), and global uncertainty is relatively subdued, at least for the moment.
Yes, it appears that the great year-end “melt-up” is nigh, but stock-pickers who try to outperform the broad indexes need to make sure that they don’t get hurt by those relatively few companies that instead melt down. Although junk rallies usually lift all boats, often led by the lower-quality momentum stocks, there are always some that get dumped. It’s inevitable. So, keeping those stinkers out of a small portfolio is essential if you want to outperform the market.
At Sabrient, we have found that a solid history of earnings growth, strong forward estimates from the Wall Street community, and a reasonable forward valuation can be good indicators of stock performance. But we also look for a solid balance sheet and sound earnings quality, more to avoid meltdowns than to identify potential high-fliers. After all, it only takes a couple of meltdowns to ruin overall portfolio performance. So, the $64 question is, how does one identify poor earnings quality, particularly if the other numbers look really good?
In order to address the ambiguities inherent in financial reporting, accounting rules allow for some discretion, but they still rely upon two fundamental principles: conservatism and objectivity. However, these two guiding principles are often pushed to their limits, particularly when the actual results aren’t quite measuring up to expectations. Sabrient subsidiary Gradient Analytics is a forensic accounting research firm that has created a tool to address the relative risks due to accrual accounting practices.
The Earnings Quality Rank (EQR) is a pure accounting-based objective assessment of a company’s sustainability of earnings and the relative level of risk (of earnings misses or restatements) across a given universe of equities. To quote from our white paper, “In general, accounting choices that cause the overstatement of economic earnings are associated with temporary earnings benefits, such as deferring the recognition of costs and/or accelerating the recognition of revenues. The earnings benefits derived from making these choices are temporary, as cost deferment or accelerated revenue recognition must ultimately reverse in the future--as the reversal of accruals is a mechanical consequence of the double-entry accounting system--normally in the form of increased expenses or lower levels of revenue generation, respectively.” Thus, it is relatively less likely that earnings will prove sustainable in future reporting periods.
For example, EQR is a key factor in Sabrient’s “Baker’s Dozen” model. The annual portfolio based on this model is now up +36.4% since the portfolio’s inception on January 11 through October 23, vs. the S&P 500 return of +18.6% over the same timeframe. Moreover, all 13 stocks are comfortably positive and 12 are up by double digits, led by Genworth Financial (GNW), Jazz Pharmaceuticals (JAZZ), Ocwen Financial (OCN), Seagate Technology (STX), Alaska Air Group (ALK), and EPL Oil & Gas (EPL)--even though EPL took a 9% haircut on Wednesday. There have been no offsetting meltdowns, and we believe our Earnings Quality Rank is a primary reason.
It is notable that Netflix (NFLX) skyrocketed during afterhours trading in the wake of its earnings report on Monday, but the next day it fell hard as key investor like Carl Icahn took the opportunity to slice his vast holdings in half, and CEO Reed Hastings called into question the euphoria around its shares. Gradient Analytics has been negative on the stock even as the speculators have bid it up, and the firm believes that nothing has changed regarding risks to the sustainability of earnings. According to senior analyst Nick Gibbons, capitalized content increased $340 million quarter-over-quarter to a new record of $3.4 billion, and the increase equates to nearly 6x quarterly operating income. Other assets also increased to record levels and accrued expenses dropped to the lowest levels since 2011, both of which raise incremental cost-recognition concerns. Furthermore, the company didn’t provide in its earnings report a breakdown of off-balance sheet exposure to content commitments.
The SPY chart: The SPDR S&P 500 Trust (SPY) closed Wednesday at 174.57, which is just shy of the all-time high achieved on Tuesday. It is now well above all its major simple moving averages. I have drawn on the chart two bullish channels. One started back in November of last year, and the other began in May of this year. Price is running into resistance from the upper line of both channels, while oscillators like RSI, MACD, and Slow Stochastic are now all overbought. Moreover, the Bollinger Bands are stretched wide. All of this points to the need for some technical consolidation before the next up leg can start. In any case, the 170 price level and the 50-day simple moving average should both serve as rock-solid support.
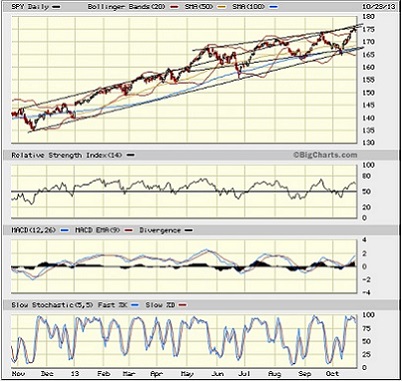
The CBOE Market Volatility Index (VIX), a.k.a. “fear gauge,” closed Wednesday at 13.42, which is back near its lows and, after a brief bought with some anxiety, once again indicates investor confidence (and complacency).
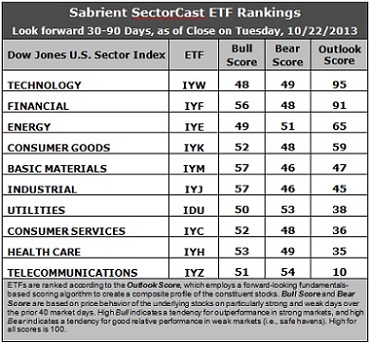
Latest rankings: The table ranks each of the ten U.S. business sector iShares ETFs by Sabrient's proprietary Outlook Score, which employs a forward-looking, fundamentals-based, quantitative algorithm to create a bottom-up composite profile of the constituent stocks within the ETF. The multi-factor model considers forward valuation, historical earnings trends, earnings growth prospects, the dynamics of Wall Street analysts' consensus estimates, accounting practices and earnings quality, and various return ratios. In addition, the table also shows Sabrient's proprietary Bull Score and Bear Score for each ETF.
High Bull score indicates that stocks within the ETF have tended recently toward relative outperformance during particularly strong market periods, while a high Bear score indicates that stocks within the ETF have tended to hold up relatively well during particularly weak market periods. Bull and Bear are backward-looking indicators of recent sentiment trend.
As a group, these three scores can be quite helpful for positioning a portfolio for a given set of anticipated market conditions.
Observations:
1. Technology (IYW) remains in the top spot with a robust Outlook score of 95. IYW displays one of the lowest forward P/Es, the best return ratios, and positive sentiment among Wall Street analysts (i.e., upgraded earnings estimates). Financial (IYF) remains in the second spot with a 91. In fact, IYW and IYF have pulled away from the pack. It is unusual to see two sectors scoring in the 90s. IYF displays a low forward P/E and positive sentiment among both Wall Street analysts and company insiders (i.e., open-market buying). In third place with a score of 65 is Energy (IYE), followed by Consumer Goods (IYK) in fourth.
2. Basic Materials (IYM) has made a big jump this week from ninth place to fifth, and its Outlook score rose from 18 to 47--quite incredible--largely due to improvements in Wall Street earnings estimates.
3. Telecom (IYZ) is in the cellar yet again with an Outlook score of 10. IYZ remains weak in all factors across the board, including a high forward P/E, low return ratios, a modest projected long-term growth rate, and poor Wall Street sentiment. Its recent outperformance is likely short-lived. In the bottom two for the first time is Healthcare (IYH), as it continues its descent, mostly due to sell-side reductions in earnings estimates.
4. This week’s fundamentals-based rankings reflect a solidly bullish bias, as Tech and Financial sit firmly at the top, with Energy, Materials, and Industrial all in the top six. Defensive sectors Telecom, Healthcare, and Utilities are in the bottom four. If Consumer Goods and Consumer Services were to swap places, the rankings would look extremely bullish.
5. Looking at the Bull scores, Industrial (IYJ) and Basic Materials (IYM) have been the leaders on particularly strong market days, scoring 57. Surprisingly, Technology (IYW) scores the lowest at 48, but only two sectors (Tech and Energy) are scoring below 50. The top-bottom spread is only 9 points this week, which indicates higher sector correlations (all boats lifted) on particularly strong market days.
6. Looking at the Bear scores, Telecom (IYZ) holds the top spot as favorite “safe haven” on weak market days, scoring 54, followed closely by Utilities (IDU). Basic Materials (IYM) and Industrial (IYJ), which shared the highest Bull scores, display the lowest Bear scores of 46. The top-bottom spread is only 8 points, which indicates lower sector correlations (across the board selling) on particularly weak market days.
These Outlook scores represent the view that Technology and Financial sectors are still relatively undervalued, while Telecom and Healthcare may be relatively overvalued based on our 1-3 month forward look.
Some top-ranked stocks within IYW and IYF include CACI International (CACI), IAC/InterActiveCorp (IACI), Prosperity Bancshares (PB), and Capital One Financial (COF). Each of these is ranks highly in the Sabrient Ratings Algorithm, and they each score in the top quintile (i.e., lowest accounting-based risk) in the Earnings Quality Rank.
Disclosure: Author has no positions in stocks or ETFs mentioned.
About SectorCast: Rankings are based on Sabrient’s SectorCast model, which builds a composite profile of each equity ETF based on bottom-up aggregate scoring of the constituent stocks. The Outlook Score employs a fundamentals-based multi-factor approach considering forward valuation, earnings growth prospects, Wall Street analysts’ consensus revisions, accounting practices, and various return ratios. It has tested to be highly predictive for identifying the best (most undervalued) and worst (most overvalued) sectors, with a 1-3 month forward look.
Bull Score and Bear Score are based on the price behavior of the underlying stocks on particularly strong and weak days during the prior 40 market days. They reflect investor sentiment toward the stocks (on a relative basis) as either aggressive plays or safe havens. So, a high Bull score indicates that stocks within the ETF have tended recently toward relative outperformance during particularly strong market periods, while a high Bear score indicates that stocks within the ETF have tended to hold up relatively well during particularly weak market periods.
Thus, ETFs with high Bull scores generally perform better when the market is hot, ETFs with high Bear scores generally perform better when the market is weak, and ETFs with high Outlook scores generally perform well over time in various market conditions.
Of course, each ETF has a unique set of constituent stocks, so the sectors represented will score differently depending upon which set of ETFs is used. For Sector Detector, I use ten iShares ETFs representing the major U.S. business sectors.
About Trading Strategies: There are various ways to trade these rankings. First, you might run a sector rotation strategy in which you buy long the top 2-4 ETFs from SectorCast-ETF, rebalancing either on a fixed schedule (e.g., monthly or quarterly) or when the rankings change significantly. Another alternative is to enhance a position in the SPDR Trust exchange-traded fund (SPY) depending upon your market bias. If you are bullish on the broad market, you can go long the SPY and enhance it with additional long positions in the top-ranked sector ETFs. Conversely, if you are bearish and short (or buy puts on) the SPY, you could also consider shorting the two lowest-ranked sector ETFs to enhance your short bias.
However, if you prefer not to bet on market direction, you could try a market-neutral, long/short trade—that is, go long (or buy call options on) the top-ranked ETFs and short (or buy put options on) the lowest-ranked ETFs. And here’s a more aggressive strategy to consider: You might trade some of the highest and lowest ranked stocks from within those top and bottom-ranked ETFs.