Sector Detector: Healthcare sector leads a strong market forward
 I was watching the ABC World News the other evening, and I was struck by the commercials they ran. The target demographic is obviously an older crowd (and since I was watching, I guess that includes me). Advertised products within the short 30-minute newscast addressed a variety of age-related ailments like low-T, erectile dysfunction, overactive bladder, constipation, hemorrhoids, and loose dentures. Each one of them was pushing some Healthcare product.
No doubt, the Healthcare sector is poised to profit from an aging population – with or without ObamaCare. And indeed, the iShares Dow Jones US Healthcare sector ETF (IYH) has led the way so far this year with a nearly 13% gain.
But that impressive performance trails Sabrient’s “Baker’s Dozen” top stocks for 2013, which is a sector-diversified portfolio of 13 high-potential stocks that is up 15.2% YTD. Last year’s annual Baker’s Dozen portfolio was up +43%, and the prior 3 years clobbered the S&P 500 return, too. This year’s portfolio is led by big gains in Marathon Petroleum (MPC), Genworth Financial (GNW), Air Lease (AL), Alaska Air Group (ALK), Manitowoc (MTW), and EPL Oil & Gas (EPL). You can see the full list and current performance at: http://www.sabrientsystems.com/bakers-dozen
On Wednesday, the Dow finished positive for the ninth straight day – the longest such streak in over two years. Last week, it gave a historically predictive “Dow Theory” buy signal when the DJIA hit an all-time high to confirm the earlier one from the Dow Jones Transportation Index. Still, many market commentators are getting queasy at these heights, especially given the unrelenting uptrend so far this year. To be sure, a correction could come at any time due to an exogenous event like the Fed scaling back their bond-buying, or failure of Congress to address the budget crisis and debt ceiling, or slowing growth in China, or an outright rejection in Europe of austerity measures.
And in this age of austerity, which stretches from Europe to my household…and hopefully soon to our bloated Federal government, it seems fitting that the new Roman Catholic pope is a Jesuit, having taken a vow of poverty and having spent a lifetime ministering to the poor and disenfranchised. It’s also fitting that he is the first pope to hail from South America, which is rapidly growing in economic influence. Yet another sign of the times.
Furthermore, some still believe that the market has been driven solely by the Fed rather than by fundamentals. There’s no doubt that the bull market that commenced in March 2009 was largely driven by the Fed’s various monetary stimulus programs, but it now appears that we have entered an actual economic expansion phase. In fact, there are lots of positive indicators that should continue to drive this market forward.
Stock valuations are still reasonable. There is substantial risk premium in equities versus bonds. Consumer confidence is relatively low. The economy is improving. Companies are hiring. Corporations are beating earnings estimates. Sideline cash is plentiful. M&A activity and stock buybacks are vibrant. Consumer spending is strong (despite stagnant wage growth, high gasoline prices, and higher payroll taxes). Also, there appears to be visible rotation from bonds into equities, as bonds have seen their correlations with equities fall to below 60%.
I suggested last week that the monthly employment report might provide the next catalyst for stocks, and it seems to have done just that. Now, the final frontier for the market is the all-time high of 1565 on the S&P 500 (and its intraday high of 1576) from October 2007. Beyond that are clear blue skies for the S&P, with only the Nasdaq facing historical resistance levels.
Overall, the technical picture remains strong, and Sabrient's fundamentals-based SectorCast rankings continue to display a bullish bias overall.
Looking at the charts, the S&P500 SPDR Trust (SPY) closed Wednesday at 155.90 and is holding on inside the narrow rising channel that I have drawn on the chart. The last couple of days have formed neutral doji candlesticks indicating indecision as price consolidates below the all-time high sitting tantalizingly close around 157. Oscillators RSI, MACD, and Slow Stochastic are all back into overbought territory, but only Slow Stochastic looks like it needs to cycle back down soon. That doesn’t mean that price will necessarily retreat, but it might remain in place to gather some steam for its assault on the highs. Minor support comes from the rising channel and then 153, followed by various levels of greater support as shown.
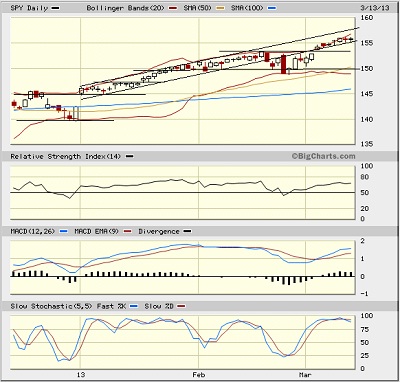
The CBOE Market Volatility Index (VIX), a.k.a. “fear gauge,” closed Wednesday at 11.83 after making another 52-week low on Monday at 11.50. This is extraordinarily low and yet another sign of the times as fearless investors see few other good options for their investment capital.
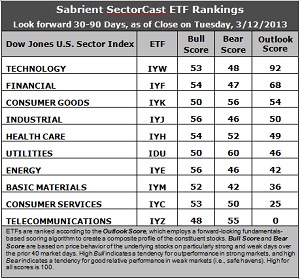
Latest rankings: The table ranks each of the ten U.S. industrial sector iShares ETFs by Sabrient's proprietary Outlook Score, which employs a forward-looking, fundamentals-based, quantitative algorithm to create a bottom-up composite profile of the constituent stocks within the ETF. The multi-factor model considers forward valuation, historical earnings trends, earnings growth prospects, the dynamics of Wall Street analysts' consensus estimates, accounting practices and earnings quality, and various return ratios. In addition, the table also shows Sabrient's proprietary Bull Score and Bear Score for each ETF.
High Bull score indicates that stocks within the ETF have tended recently toward relative outperformance during particularly strong market periods, while a high Bear score indicates that stocks within the ETF have tended to hold up relatively well during particularly weak market periods. Bull and Bear are backward-looking indicators of recent sentiment trend.
As a group, these three scores can be quite helpful for positioning a portfolio for a given set of anticipated market conditions.
Observations:
1. The rankings haven’t changed much this week. Technology (IYW) continues to sit well above the others, with an Outlook score of 92. Anything above 90 is quite impressive. Financial (IYF) remains in second place with a 68. IYW is strong across the board with a low forward P/E, solid (and growing) support from Wall Street analysts, strong projected long-term growth, and the best return ratios. IYF also displays a low forward P/E and solid support from Wall Street, and has a reasonable projected long-term growth rate.
2. Telecom (IYZ) stays in the cellar with a rock-bottom Outlook score of 0. It has the least support among Wall Street analysts, the worst return ratios, the highest (worst) forward P/E, and a low projected long-term growth rate. It is joined in the bottom two by Consumer Services (IYC) with a score of 25. Although IYC is expected to have the highest long-term growth rate, it is hindered by a high forward P/E and net downward analyst revisions.
3. Overall, this week’s rankings appear to have halted the slightly defensive turn they had taken during the past few weeks. Industrial (IYJ) has risen to fourth while Utilities (IDU) has fallen from third to sixth. Still, only four sectors are scoring above 50, which is somewhat concerning. But the top-bottom spread of 92 points is quite wide, which theoretically reflects greater conviction. Overall, I would say that the rankings continue to display a bullish bias.
4. Looking at the Bull scores, Energy (IYE) and Industrial (IYJ) are the leaders on strong market days, scoring 56. Defensive sector Telecom (IYZ) is the laggard on strong market days, scoring 48. The top-bottom spread is only 8 points, which continues to indicate high correlation (all boats lifted) on strong days. This basically corroborates the 85% average sector correlation to the overall market that ConvergEx reported in their monthly review of price correlations.
5. Looking at the Bear scores, Utilities (IDU) is serving as the favorite “safe haven” on weak market days, scoring 60, while Basic Materials (IYM) is the worst during market weakness as reflected in its low Bear score of 42. The top-bottom spread is 18 points, which indicates lower correlations on weak days.
6. Overall, Technology (IYW) shows the best all-weather combination of Outlook/Bull/Bear scores. Adding up the three scores gives a total of 193. Telecom (IYZ) is by far the worst at 103. Looking at just the Bull/Bear combination, defensive sector Utilities (IDU) remains at the top with a total score of 110, followed by two more defensive sectors, IYH and IYK. Materials (IYM) displays by far the lowest score at 94. This indicates that Utilities stocks have tended to perform the best in extreme market conditions (whether bullish or bearish).
These Outlook scores represent the view that Technology and Financial sectors may be relatively undervalued, while Telecom and Consumer Services sectors may be relatively overvalued based on our 1-3 month forward look.
Top-ranked stocks within Technology and Financial include VMware (VMW), CACI International (CACI), Allied World Assurance (AWH), and BlackRock (BLK).
Disclosure: Author has no positions in stocks or ETFs mentioned.
About SectorCast: Rankings are based on Sabrient’s SectorCast model, which builds a composite profile of each equity ETF based on bottom-up aggregate scoring of the constituent stocks. The Outlook Score employs a fundamentals-based multi-factor approach considering forward valuation, earnings growth prospects, Wall Street analysts’ consensus revisions, accounting practices, and various return ratios. It has tested to be highly predictive for identifying the best (most undervalued) and worst (most overvalued) sectors, with a 1-3 month forward look.
Bull Score and Bear Score are based on the price behavior of the underlying stocks on particularly strong and weak days during the prior 40 market days. They reflect investor sentiment toward the stocks (on a relative basis) as either aggressive plays or safe havens. So, a high Bull score indicates that stocks within the ETF have tended recently toward relative outperformance during particularly strong market periods, while a high Bear score indicates that stocks within the ETF have tended to hold up relatively well during particularly weak market periods.
Thus, ETFs with high Bull scores generally perform better when the market is hot, ETFs with high Bear scores generally perform better when the market is weak, and ETFs with high Outlook scores generally perform well over time in various market conditions.
Of course, each ETF has a unique set of constituent stocks, so the sectors represented will score differently depending upon which set of ETFs is used. For Sector Detector, I use ten iShares ETFs representing the major U.S. business sectors.
About Trading Strategies: There are various ways to trade these rankings. First, you might run a sector rotation strategy in which you buy long the top 2-4 ETFs from SectorCast-ETF, rebalancing either on a fixed schedule (e.g., monthly or quarterly) or when the rankings change significantly. Another alternative is to enhance a position in the SPDR Trust exchange-traded fund (SPY) depending upon your market bias. If you are bullish on the broad market, you can go long the SPY and enhance it with additional long positions in the top-ranked sector ETFs. Conversely, if you are bearish and short (or buy puts on) the SPY, you could also consider shorting the two lowest-ranked sector ETFs to enhance your short bias.
However, if you prefer not to bet on market direction, you could try a market-neutral, long/short trade—that is, go long (or buy call options on) the top-ranked ETFs and short (or buy put options on) the lowest-ranked ETFs. And here’s a more aggressive strategy to consider: You might trade some of the highest and lowest ranked stocks from within those top and bottom-ranked ETFs.