Sector Detector: Frothy market awaits consolidation and new catalysts
 By Scott Martindale
President, Sabrient Systems LLC
Last week, in the wake of the President’s address to Congress, stocks rallied hard but ran into a brick wall at Dow 21,000, NASDAQ 5,900, and S&P 500 2,400. For the moment, optimism is high due to solid economic and corporate earnings reports along with the expectation that economic skids will soon be greased by business-friendly fiscal policies. But the proof is in the pudding, as the saying goes, and the constant distractions from a laser focus on the Trump agenda are becoming worrisome – not to mention the many uncertainties in Europe, North Korea’s missile launches, and China’s lowered growth projection as it tries to address its high debt build-up. Nevertheless, capital continues to flow into risk assets.
In this periodic update, I give my view of the current market environment, offer a technical analysis of the S&P 500 chart, review Sabrient’s weekly fundamentals-based SectorCast rankings of the ten U.S. business sectors, and then offer up some actionable ETF trading ideas. Overall, our sector rankings still look bullish, and the sector rotation model continues to suggest a bullish stance. Read on....
Market overview:
It took me longer than usual to put together this market commentary. There’s just so much going on and so much to say. But first of all, let me mention that Sabrient’s ninth annual Baker’s Dozen top stocks list for 2017 just completed another successful launch and asset raise for the unit investment trust offered by First Trust Portfolios. During my (and my colleagues’) travels around the country in support of the sales effort, it was evident that there is a renewed optimism among the financial advisor community about the economy and the stock market. If you are a regular reader of my Sector Detector articles, you know that my outlook has ranged from cautiously optimistic to solidly bullish for quite some time, based on both fundamentals and technicals. Indeed, investors appear to be rewarding fundamentals once again and are generally back in alignment with the expectations of the analyst community, which is “typical” behavior.
As a result, sector correlations have fallen, dispersion has increased, and small-mid caps have been strong, meaning that investors are picking their spots rather than engaging in narrow, risk-on/risk-off, fear-based trading. According to ConvergEx, there has been a notable reduction in sector and asset class correlation as compared to the 2009-2016 timeframe, putting them back to historically “normal” levels. Correlation among the 11 sectors of the S&P 500 has fallen from the 75-80% range before the election to 57-62% shortly thereafter, and then more recently it fell even further to the mid-50s. This implies lower volatility for the broad indexes as winning and losing market segments offset each other, and it highlights the importance of good stock picking.
Over both the past three months and the past 12 months, the top performing sectors have been Financials, Industrials, Materials, and Technology. Although Healthcare is the worst performer in the S&P 500 over the past 12 months, it has perked up more recently. In fact, the biotech segment, which had been languishing under election campaign rhetoric, now appears to be breaking out. On the other hand, retailers as a whole have been struggling.
But it goes without saying that a continued upward path for US stocks will not be a straight line. On the contrary, I fully expect a significant (and perhaps scary!) selloff at some point this year, and the longer the market goes without such a pullback the worse it will be when it eventually comes. Nevertheless, unless it comes in response to a game-changing “Black Swan” event that sends the global economy into turmoil or hinders implementation of the new administration’s widely-anticipated fiscal policies, I would expect such an occurrence to be a welcome buying opportunity.
President Trump gave an impressive and potentially unifying speech last Tuesday night. At least the stock market liked it, as the next day the Dow gained more than 300 points to surge above 21,000, and an incredible $8.2 billion flowed into the S&P 500 SPDR Trust ETF (SPY). However, most of this post-election market advance has come courtesy of multiple expansion, which is not sustainable. For example, the trailing P/E on the S&P 500 is now 22x and the forward P/E hit 18.5x when the S&P peaked at 2400 last Wednesday. But I expect a gradual contraction in multiples over time, which means that stocks will need to rely on earnings growth – preferably with plenty of upside surprises – and this will require a corporate focus on capital investment and top-line growth – not just stock buybacks, cost-cutting, and productivity gains. The bad news on this subject is that the street has become a bit more cautious, slightly reducing consensus 2017 earnings, even as investors have become more optimistic. Corporate tax reform alone may boost earnings, encourage overseas cash repatriation, boost dividends, increase stock buybacks, and provide the fuel for capex (the driver of real growth). Add in regulatory reform and perhaps some significant infrastructure and defense spending, and a surge in capital expenditures can provide demand for new equipment, new business formations – which particularly bodes well for the small cap space.
Although the new Administration’s business-friendly proposals have contributed to the enthusiasm, stock performance ultimately comes down to corporate earnings. And overall, Q4 earnings reports have shown numerous positive earnings surprises and raised guidance. It appears earnings growth for the quarter reflects about 7.5% quarter-over-quarter improvement (on revenue growth of about 5%). More than 2/3 of S&P 500 companies beat on earnings and more than half beat on revenues. It is evident that many multinationals were able to offset the impact of the strong dollar by issuing corporate debt in offshore markets at ultra-low interest rates and buying back shares to bolster reported EPS.
Although S&P 500 earnings have been flat for the past three years in the range of $117-$119/share, Q4 2016 was the strongest since Q4 2014. Looking ahead, EPS for 2017 is expected to be $130, and dividing this by the recent all-time high on the price index of nearly 2400 produces an earnings yield of 5.4%, whereas the 10-year Treasury is only yielding around 2.5%. That’s quite a risk premium, assuming rates aren’t on the verge of spiking. So, on this comparison, there is more room for upside in equities.
Looking ahead, I see a continued improvement in economic fundamentals (both in the US and abroad) that should encourage investors to hold higher levels of risk assets, including equities. GDP growth has been improving, the corporate “profit recession” has come to an end, capital expenditures are expected to rise with new incentives, and leading economic indicators are strong (and rising). Wages, employment, and personal and corporate spending continue to improve, fueling positive trends in equity correlations (lower) and dispersion (higher). Investors are more discerning in picking their spots, and good stock-picking and savvy active managers should have a better opportunity to outperform – notably, this is happening just when the financial media has all but counted them out, pronouncing pure-beta passive investing as the “new normal.”
For Q3 2016, the final GDP estimate was adjusted to a robust 3.5% (annualized); however, Q4 came in at an annual rate of only 1.9%, which was below the previous estimate of 2.1%. For the full year, US GDP grew just 1.6% in 2016, the slowest since 2011. The good news, though, is that consumer spending was stronger than previously estimated, rising 3.0% compared with the original estimate of 2.5%. The strong dollar helped imports surge above expectations while exports declined, which hurt overall GDP growth due to the wider trade deficit. Today, the Atlanta Fed’s GDPNow model forecast for real GDP growth (seasonally adjusted annual rate) in Q1 2017 came in at 1.3%, which compares to 1.8% on March 1 and 2.5% on February 27. Obviously, there can be a lot of volatility in this metric from week to week.
Case-Shiller home prices reported a +5.6% increase, which (along with slightly higher mortgage rates) not surprisingly push pending home sales to a 12-month low. Unemployment claims came in at 233k, which is a 44-year low. The short month of February resulted in the official jobs report being delayed until this Friday. US core personal consumption expenditures (PCE) rose to +1.9% (Fed target is 2.0%), Consumer Confidence hit 114.8 (while most of 2016 languished under 100), Chicago PMI soared from 50.3 to 57.4, and University of Michigan Consumer Sentiment posted 98.5 (marking the highest reading since January 2004). ISM Manufacturing for February increased to 57.7% (from January’s 56.0%) – its highest level since August 2014 and the sixth straight month the index has been above 50.0 (the dividing line between expansion and contraction) – and under the hood, New Orders increased from 60.4 to 65.1, Production increased from 61.4 to 62.9 (the highest since March 2011), Backlog rose from 49.5 (contraction) to 57.0 (the highest since March 2014), and Inventories emerged from 19 months of contraction, rising from 48.5 to 51.5. And finally, we have oil prices holding firmly above $50 and in the Goldilocks range in which oil companies can invest and make money, but without hurting consumers at the pump.
China cut its growth target this year, and it wants to institute difficult reforms to reduce debt (including debt-to-equity swaps) and protections from financial risks. The country is now targeting economic growth around 6.5% – versus 6.7% last year, although it was supported by record levels of bank loans, a speculative housing boom, and massive government investment, none of which are sustainable. So now the government will try to cool off the housing market, slow the growth of new credit, and tighten government spending, instead encouraging domestic consumption and private investment. A tall order indeed. When people have asked me what I consider the biggest risk to the global economy (and US equities) going forward, it is not so much the success of Trump’s agenda but rather the ability of China to overcome its massive debt, support its currency, and continue to maintain stable growth.
Of course, no matter what happens with Trump’s intended policies, equity valuations will be mostly dependent upon earnings and interest rates. So, higher equity valuations are more realistic when long-term rates remain relatively low, and of course many market commentators have been predicting escalating rates and many traders and hedge funds have put on large short positions in bonds. But Mr. Market likes to fool the greatest number of people, and those who have been reading my articles or listening to my talks on the road know that I think there are a lot of global dynamics that will keep a lid on long-term rates, no matter what the Fed does on the short end of the curve. Although I’m no economist, I don’t see the 10-year reaching 3.0% this year, and I wouldn’t be surprised if we saw some flattening of the yield curve later in the year as short-term rates rise a bit further while longer-term rates stabilize or even recede.
Why? Well for starters, the year-over-year price comparisons in oil and commodities will be less drastic such that inflation (or “reflation”) slows, thus reducing the incentive for traders to short 10-year bonds and at the same time launching a short squeeze for those who already hold huge short positions in bonds. Also, with overseas issues like the upcoming election in France and the potential for a “Frexit,” global investors continue to employ the “carry trade” into the dollar and the safety and higher yields of US bonds – as well as high-quality dividend-paying stocks. I have been talking about this for a while, and now I see that Barron’s published an article on Monday suggesting the same thing. Jeffrey Gundlach of DoubleLine Capital recently said that he now expects the 10-year yield to drop below 2.25% in a global flight to safety. And Warren Buffett predicted that the yield curve would flatten, thus further supporting equity valuations. It’s nice to see such an illustrious group come over to my way of thinking. Do you think they read Sector Detector?
The 10-year Treasury closed Monday at 2.49%. (As a reminder, it closed 2016 at 2.45%.) The 30-year closed Monday at 3.10%. On the short end of the yield curve, the 2-year closed at 1.31% and the 5-year at 2.02%. The spread between the 10-year and 2-year fell to 118 bps, while the spread between the 30-year and 5-year fell to 108 bps. As for next week’s FOMC meeting, Chairwoman Janet Yellen recently stated in a speech to the Executives Club of Chicago, “The U.S. economy has exhibited remarkable resilience in the face of adverse shocks in recent years, and economic developments since mid-2016 have reinforced the Committee's confidence that the economy is on track to achieve our statutory goals." Thus, CME fed funds futures now place the odds of the next rate hike occurring in March at 86%, which is pretty much a certainty (for the moment). After that, the odds of an additional rate hike in June is 41%. By year end, there is now a 99% chance of at least one hike, an 87% chance of at least two, 55% of at least three, and 21% odds of four rate hikes. Interestingly, futures are pricing in a 40% probability of an ECB rate hike in January 2018.
The CBOE Market Volatility Index (VIX), aka fear gauge, closed Monday at 11.24. After spiking to as high as 23 in advance of the November 8 election, it has closed every day since then securely below the 15 threshold between complacency and fear – which is now going on four months. There is no investor fear in this market.
Potentially market-moving events over the next several days include the BLS jobs report on Friday, the FOMC meeting and rate announcement the following Wednesday, and the expiration of the debt ceiling suspension on the same day (when it resets to about $20 trillion). Once it expires, the Treasury Secretary will then start implementing “extraordinary accounting measures” in order to keep paying the bills without violating the borrowing limit. Getting that ceiling raised again might be more difficult than ever this time around, and estimates indicate that the special measures likely will be exhausted by October or November. We will see if Congress can put together a budget and address the debt ceiling.
One last topic. Sorry, but I can’t help but make some comments on our politically polarized society, given the potential impact on the economy and stock prices. During Trump’s speech to Congress last Tuesday, he was refreshingly presidential for a guy who has positioned himself as the proverbial bull in the china shop, intent on shaking things up and “draining the swamp.” Nevertheless, battle lines have been drawn, as per usual, and it is political suicide to retreat once an opposing politician has dug in so firmly. Yet it never ceases to amaze me the lack of cooperation within our government. In a private company, you can have rancorous debate on strategic direction or new leadership, but once the decision is made, cooperation is essential for the company’s survival in a brutally competitive marketplace, and everyone must be onboard and working together for there to be any chance at success. However, in government, compromise is anathema and cooperation can come back to haunt you at election time. And so obstructionism reigns.
After all, if Trump succeeds with his America-first agenda and the country prospers, the Democrats won’t be able to take back control in four years. So, Dems are dutifully hysterical with negativity and granting no quarter, with all hands on deck (led by Schumer and Pelosi) to ensure that Trump fails in all his initiatives. Remember several years ago when Ted Cruz and the Tea Party Republicans refused to compromise with Obama on anything because they felt his largely socialist policies would be our downfall? Well, today we are seeing the same thing from the other side of the aisle. Conservatives see liberals as bleeding-hearted, short-sighted, and naive, while liberals see conservatives as unfeeling, fascist, and evil. And “Job 1” for all of them is never the economy or health care or national security; it is to get your party back in power.
But the vitriol against this Administration is different. Things have devolved into an unprecedented level of partisan acrimony. You would think we elected Mussolini. Sure, Trump could help himself better by staying focused on his agenda for the country. (And would someone please close his Twitter account?) But for me, although I’m not a big fan of Trump’s combative style and brusque language or his propensity to fire off ill-advised tweets, I am even less of a fan of business-as-usual in D.C., and I’m willing to give him a chance to shake things up. There is real potential to improve the station of all Americans, with the promise of long-overdue fiscal stimulus, including tax & regulatory reform and infrastructure & defense spending, and shoring up of ill-functioning healthcare, schools, borders, trade deals, and inner cities. After all, it is my contention that our singular reliance on Fed monetary stimulus for the past several years resulted in persistently anemic economic growth, asset inflation without wage inflation, falling corporate capex, a “profit recession,” and the worsening wealth gap, which had a lot to do with creating the populist movement that gave rise to both Donald Trump and Bernie Sanders as alternatives to the candidates of the entrenched political machine.
The other day, I heard the old Buffalo Springfield song “For What It’s Worth” on the classic rock station, and it occurred to me how so much is the same today as in 1967 when it comes to a divided nation, “a thousand people in the street…carrying signs,” etc. We are a sound-bite nation in so many ways in which people simply refuse to listen to, or seek to understand, any opposing viewpoint. And unfortunately, the advent of social media has only served to speed up the exchange of vitriol, solidify unyielding positions, and exacerbate the dearth of mutual respect, rather than promote understanding. Free speech is no longer welcome on college campuses if the speech does not conform to what the majority wants to hear. As Buffalo Springfield sang, “It’s time to stop…nobody’s right if everybody’s wrong.”
SPY chart review:
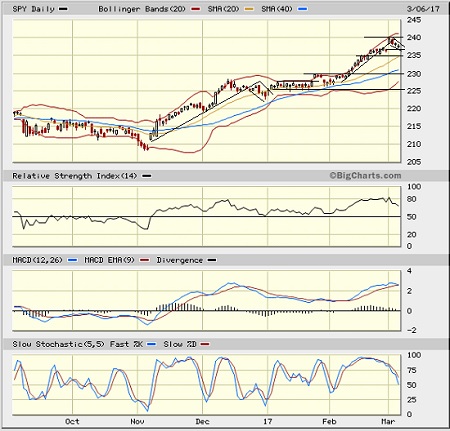
The SPY closed Monday at 237.71, after hitting another new high last week on March 1 near 240. No doubt, stocks have been on a tear. It has been since election day when the S&P 500 last closed below its 50-day simple moving average, and it was the June Brexit vote when it last dipped below its 200-day SMA (albeit for a single day – March 10 was the last time it held for longer below the 200-day). The post-election rally ended the year by forming a bull flag continuation pattern, leading next into a very narrow sideways consolidation pattern for most of January, finishing January with a minor breakout, then further consolidation to gather bullish conviction. Next, a powerful February rally led into the President’s address to Congress, followed by a big gap up on March 1, and now a pullback into what apparently is another bull flag pattern. This pullback has also served to fill the gap from March 1, which I expect will resolve to the upside (provided the news about Russia and wiretapping doesn’t go completely over the top). It is notable that most of the major levels of resistance-turned-support have been round numbers (on the 5’s and 10’s).
The 20-day simple moving average has been providing reliable support ever since the election, and it is now converging with a line of support at 235. Other support below the 20-day SMA includes the 50-day around 230, the previous bull flag breakout level at 225, the 100-day SMA now crossing above 224, prior resistance-turned-support at 220, and the critical 200-day (approaching 219). Not surprisingly, all of these moving averages are rising, which is bullish. On the other hand, oscillators RSI, MACD, and Slow Stochastic have all turned downward from overbought territory and will likely need to fall a good bit further. So, price likely will pull back further, as well, at least for the short term. Nevertheless, looking further out, I continue to like the technical picture.
Latest sector rankings:
Relative sector rankings are based on our proprietary SectorCast model, which builds a composite profile of each of over 600 equity ETFs based on bottom-up aggregate scoring of the constituent stocks. The Outlook Score employs a forward-looking, fundamentals-based multifactor algorithm considering forward valuation, historical and projected earnings growth, the dynamics of Wall Street analysts’ consensus earnings estimates and recent revisions (up or down), quality and sustainability of reported earnings (forensic accounting), and various return ratios. It helps us predict relative performance over the next 1-3 months.
In addition, SectorCast computes a Bull Score and Bear Score for each ETF based on recent price behavior of the constituent stocks on particularly strong and weak market days. High Bull score indicates that stocks within the ETF recently have tended toward relative outperformance when the market is strong, while a high Bear score indicates that stocks within the ETF have tended to hold up relatively well (i.e., safe havens) when the market is weak.
Outlook score is forward-looking while Bull and Bear are backward-looking. As a group, these three scores can be helpful for positioning a portfolio for a given set of anticipated market conditions. Of course, each ETF holds a unique portfolio of stocks and position weights, so the sectors represented will score differently depending upon which set of ETFs is used. We use the iShares that represent the ten major U.S. business sectors: Financial (IYF), Technology (IYW), Industrial (IYJ), Healthcare (IYH), Consumer Goods (IYK), Consumer Services (IYC), Energy (IYE), Basic Materials (IYM), Telecommunications (IYZ), and Utilities (IDU). Whereas the Select Sector SPDRs only contain stocks from the S&P 500, I prefer the iShares for their larger universe and broader diversity.
Here are some of my observations on this week’s scores:
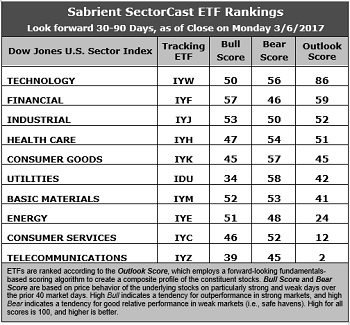
1. Technology retains the top spot with an Outlook score of 86. In aggregate, stocks within the sector display solid Wall Street sell-side analyst sentiment (i.e., net positive revisions to EPS estimates), the highest return ratios, a reasonable forward P/E of about 17.7x, a strong forward long-term EPS growth rate of 13.0%/yr, and a low forward PEG of 1.36 (ratio of forward P/E to forward EPS growth rate). Then there is a big drop down to Financial, which takes the second spot with an Outlook score of 59 and the second lowest forward P/E of 17.3x. Industrial is now in third at 52, followed closely by Healthcare at 51. Notably, Healthcare now displays the lowest forward P/E of 16.3x as uncertainty around the sector has held it back, and Energy boasts by far the highest year-over-year forward EPS growth rate (23.9%) and the lowest forward PEG (1.22), despite having the highest forward P/E of 29.2x.
2. Telecom and Consumer Services (Discretionary/Cyclical) remain in the bottom two with Outlook scores of 2 and 12. Telecom displays the weakest insider sentiment (net open market buying) and analyst sentiment (i.e., net negative earnings revisions), as well as the second highest forward P/E of 24.3x and the second highest forward PEG of 2.35. Consumer Services displays generally mediocre factor scores across the board, with the exception of the second highest forward long-term EPS growth rate of 13.4%.
3. Looking at the Bull scores, Financial boasts the top score of 57 as it has displayed relative strength on strong market days, while Utilities is the lowest at 34. The top-bottom spread is 23 points, which reflects low sector correlations on strong market days, which is favorable for stock picking. It is desirable in a healthy market to see low correlations reflected in a top-bottom spread of at least 20 points, which indicates that investors have clear preferences in the market segments and stocks they want to hold (rather than broad risk-on behavior).
4. Looking at the Bear scores, we find Utilities at the top with a score of 58, followed closely by Consumer Goods (Staples/Noncyclical) at 57, which means that stocks within these sectors have been the preferred safe havens lately on weak market days. Indeed, these are the traditionally defensive sectors. Telecom surprisingly scores the lowest at 45, followed closely by Financial at 46, as investors have fled during market weakness. The top-bottom spread is 13 points, which reflects moderately high sector correlations on weak market days. Ideally, certain sectors will hold up relatively well while others are selling off (rather than broad risk-off behavior), so it is desirable in a healthy market to see low correlations reflected in a top-bottom spread of at least 20 points.
5. Technology displays by far the best all-around combination of Outlook/Bull/Bear scores, while Telecom is by far the worst. Looking at just the Bull/Bear combination, Technology is again the highest, followed by Basic Materials, indicating superior relative performance (on average) in extreme market conditions (whether bullish or bearish), while Telecom is again the worst.
6. This week’s fundamentals-based Outlook rankings look solidly bullish to me, given that the top four sectors are economically-sensitive or all-weather (Technology, Financial, Industrial, Healthcare). Keep in mind, the Outlook Rank does not include timing, momentum, or relative strength factors, but rather reflects the consensus fundamental expectations at a given point in time for individual stocks, aggregated by sector.
ETF Trading Ideas:
Our Sector Rotation model, which appropriately weights Outlook, Bull, and Bear scores in accordance with the overall market’s prevailing trend (bullish, neutral, or defensive), still displays a bullish bias and suggests holding Financial (IYF), Technology (IYW), and Industrial (IYJ), in that order. (Note: In this model, we consider the bias to be bullish from a rules-based trend-following standpoint when SPY is above both its 50-day and 200-day simple moving averages on the rebalance day.)
Besides iShares’ IYF, IYW, and IYJ, other highly-ranked ETFs in our SectorCast model (which scores over 600 US-listed equity ETFs) from the Financial, Technology, and Industrial sectors include PowerShares KBW Bank Portfolio (KBWB), First Trust NASDAQ-100 Tech Sector Index Fund (QTEC), and VanEck Vectors Steel ETF (SLX).
If you prefer a neutral bias, the Sector Rotation model suggests holding Technology, Financial, and Industrial, in that order. On the other hand, if you are more comfortable with a defensive stance on the market, the model suggests holding Technology, Utilities, and Consumer Goods (Staples/Noncyclical), in that order.
By the way, an assortment of other unique ETFs that happen to score well in our latest rankings include ALPS Sprott Buzz Social Media Insights (BUZ), iShares US Home Construction ETF (ITB), WBI Tactical LCY Shares (WBIG), First Trust NASDAQ Rising Dividend Achievers (RDVY), John Hancock Multifactor Technology (JHMT), PureFunds ISE Mobile Payments (IPAY), Guggenheim Invest S&P 500 Equal Weight Financials (RYF), iShares US Financial Services (IYG), and the First Trust LongShort Equity ETF (FTLS), which licenses Sabrient’s Earnings Quality Rank (co-developed with our wholly-owned subsidiary Gradient Analytics, a forensic accounting research firm).
IMPORTANT NOTE: I post this information periodically as a free look inside some of our institutional research and as a source of some trading ideas for your own further investigation. It is not intended to be traded directly as a rules-based strategy in a real money portfolio. I am simply showing what a sector rotation model might suggest if a given portfolio was due for a rebalance, and I may or may not update the information on a regular schedule. There are many ways for a client to trade such a strategy, including monthly or quarterly rebalancing, perhaps with interim adjustments to the bullish/neutral/defensive bias when warranted, but not necessarily on the days that I happen to post this article. The enhanced strategy seeks higher returns by employing individual stocks (or stock options) that are also highly ranked, but this introduces greater risks and volatility. I do not track performance of the ideas mentioned here as a managed portfolio.
Disclosure: The author has no positions in stocks or ETFs mentioned.
Disclaimer: This newsletter is published solely for informational purposes and is not to be construed as advice or a recommendation to specific individuals. Individuals should take into account their personal financial circumstances in acting on any rankings or stock selections provided by Sabrient. Sabrient makes no representations that the techniques used in its rankings or selections will result in or guarantee profits in trading. Trading involves risk, including possible loss of principal and other losses, and past performance is no indication of future results.