Sector Detector: Fear and uncertainty hamper a quick turnaround in stocks
For those investors who thought there might be a quick V-bottom recovery in the markets like we saw last October, they have been sorely disappointed. Last week, the Dow Industrials fell -3.2%, the S&P 500 large caps fell -3.4%, the Nasdaq was down -3.0%, and the Russell 2000 small caps dropped -2.3%.From a technical standpoint, most chartists agree that much damage has been done to the charts and the market seems quite vulnerable and likely to retest lows. Market breadth is poor. And from a fundamental standpoint, the list of concerns is long. Nevertheless, it seems to me that on balance there are more reasons for U.S. stocks to rise than to fall over the next 12 months, with solid comparisons being made to price action and market conditions in 1998. I am not suggesting that new highs on the stock market are imminent, and indeed a breakdown below the October lows is a definite possibility in the near term. But in the longer term, the odds are strong that the global ship will be righted, with the U.S. at the helm, and corporate revenues and earnings will eventually lead stocks higher.
In this weekly update, I give my view of the current market environment, offer a technical analysis of the S&P 500 chart, review our weekly fundamentals-based SectorCast rankings of the ten U.S. business sectors, and then offer up some actionable trading ideas, including a sector rotation strategy using ETFs and an enhanced version using top-ranked stocks from the top-ranked sectors.
Market overview:
Where to start? How about this. I have been doing quite a bit of traveling over the past five weeks, speaking with financial advisors in support of First Trust Portfolio’s launch of the unit investment trust that tracks Sabrient’s first mid-year Baker’s Dozen portfolio (we have been publishing a January top picks list since 2009). My latest travels have taken me to all four corners of the nation, from Orlando to Seattle to San Diego to Hartford, CT, plus Chicago and Philadelphia. And my colleagues have helped fill in when I couldn’t be two places at once, including Buffalo, Minneapolis, Little Rock, Cleveland, San Francisco, Tampa, and Charlotte. The reception from the advisor community has been overwhelmingly supportive, and it has been a pleasure to meet you all.
Of course, the level of trepidation regarding the market is high, and diverse views as to the overall direction abound, from new highs coming to the start of a bear market. Although the majority seem to view the recent market weakness as a long-awaited buying opportunity (a second chance, if you will), there are definite pockets of fear and loathing. Some think we are entering a cyclical bear within a longer-term secular bull market, and then there are those who view the past 6-year bull run as nothing more than a cyclical bull within a longer-term secular bear market.
In times like this, the various talking heads get a lot more air time, and advisors have been trotting out names like John Hussman, Nouriel Rubini, Jim Rickards, and Robert Shiller on the bear side, and names like Lee Cooperman, Jim Paulsen, Brian Wesbury, and Adam Parker on the bull side. Hussman says that the latest pullback was due to overvalued, overbought, overbullish conditions being joined by deteriorating market internals (i.e., more risk-averting than risk-seeking) and it was probably just a start of bad things to come. On the other hand, Wesbury asserts that recent data on auto sales, housing, initial claims, inventories, and investment point to improving GDP growth for Q3 while incomes and spending go up and corporate cash flow is at a record high. And Paulsen observes that historically, when commodity prices collapse in the middle of an economic recovery, usually what follows is an acceleration in economic growth, while recession risk is greater after a surge in prices. Cooperman says that bull markets have never ended before a single Fed rate hike. What to make of it all?
Without putting my own spin on all of the various scenarios and rationales, let me for a moment comment on the bigger picture, beyond all the data and charts. That is, all of us around the world are in this together, and the onward progression of globalization is making it more so all the time. Today, we are seeing synchronized global policy stimulation comprising QE and rate cuts. Everyone in the G20 is essentially working to move in the same direction, and that direction calls for economic expansion and growing asset values across the board. There is little in the way of a zero-sum-game mentality anymore in which one country feels it must undercut another in order to achieve prosperity for its hungry masses at the expense of its neighbor.
If done right, we can all prosper. And no one is wishing the U.S. ill will (no matter what they might say out loud for political reasons), because at the end of the day, they all depend upon a healthy U.S. to propel the global economy. No matter what you might hear about the end of the dollar as the world’s reserve currency, when times are tough elsewhere, capital always flows into the safety of the U.S., regardless of what our monetary policy might suggest at any given time.
Indeed, global capital continues to flow into Treasuries. The 10-year yield closed Friday at 2.13%. The G20 statement indicates a desire for the 10-year to head back to 3%, but that doesn’t seem likely any time soon. Fed funds futures are indicating only 19% probability of a rate hike to 50 bps this month and only a 40% chance by December.
The CBOE Market Volatility Index (VIX), a.k.a. fear gauge, closed Friday at 27.80, which is just about the same level it was when I last wrote this column two weeks ago, and over that period of time it has consistently remained above the 20 panic threshold that previously held up as resistance throughout the summer.
Certainly there has been a lot of damage to the charts, and market breadth is poor. Moreover, there are plenty of fundamental concerns. Growing signs of recession around the globe, mostly driven by oversupply of commodities due to artificial demand created by China. Slowing growth in China and downward revisions to prior growth (the end of the China Miracle?). China’s clumsy attempt to slowly manage its currency devaluation and the associated capital outflow. Slowing global trade. Slowing growth in U.S. manufacturing. Poor corporate sales growth. Sluggish GDP growth. Relatively high price-to-sales, high cyclically-adjusted P/E, and downward revisions to earnings estimates.
Moreover, many commentators are predicting the end to the so-called Yellen put, as the Fed seeks to normalize interest rates (move away from ZIRP) and unwind its fat balance sheet of Treasuries and asset-backed securities. And then we have the latest statements from the G20 meeting, essentially saying that monetary policy alone isn’t going to cut it after all, and real structural reforms are needed to stave off further weakening. Indeed, QE was able to restore confidence in the banking system, tighten credit spreads, bring down yields and mortgage rates, and boost asset prices, including stocks, bonds, and real estate, but it has not boosted GDP or corporate revenue growth.
Nevertheless, despite all of these challenges, it seems to me that on balance there are still more reasons for U.S. stocks to rise than to fall over the next 12 months, especially when you compare the various investment alternatives. While new highs do not seem imminent and a breakdown below the October lows is possible, the odds are strong that the global ship eventually will be righted and corporate revenues and earnings will lead stocks higher.
SPY chart review:
The SPDR S&P 500 Trust (SPY) closed Friday at 192.59. After the long sideways consolidation and neutral pennant formation broke so hard to the downside, it was inevitable that some retesting of new support levels and bullish conviction would occur, particularly given the daily dose of discouraging news and global uncertainties during the final vestiges of summer. All the major averages remain well below their 200-day simple moving averages. Oscillators like RSI, MACD, and Slow Stochastic are all back to neutral positions. After bouncing from the capitulation lows (that actually tested the October lows from last year), price ran into resistance at the 200 level and has since done some normal backing and filling. But I expect a continued recovery back to retest the resistance at the 200 level and ultimately the 204 price level (the bottom of the prior trading range), where the price gap should act as a magnet of sorts.
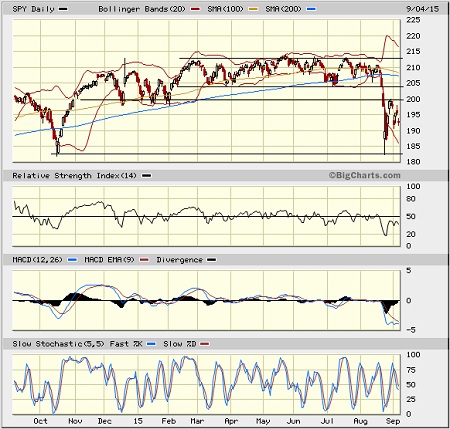
Many chartists are seeking comparisons with historical patterns in 2014, 2011, and all the way back in 1998. In October 2014, the sharp breakdown below the 200-day moving average was followed by a quick recovery back above the 200-day SMA, while in August 2011, the breakdown below the 200-day SMA was not quickly recovered until later in the year when the Fed finally announced another new QE program. Of course, in the current climate, there is little hope of a new QE and instead the Fed is looking for an opportunity to begin tightening. In late-August 1998, an economic crisis in Asia (caused by severe recession in Japan) and imminent rate hikes from the Fed led the S&P 500 to loss support at the 200-day SMA, and after a couple of failed attempts it finally recaptured it two months later, in late October. Perhaps we will see something similar this year, with the Fed again threatening to hike rates and an economic malaise caused by a slowdown in China this time.
Latest sector rankings:
Relative sector rankings are based on our proprietary SectorCast model, which builds a composite profile of each equity ETF based on bottom-up aggregate scoring of the constituent stocks. The Outlook Score employs a forward-looking, fundamentals-based multifactor algorithm considering forward valuation, historical and projected earnings growth, the dynamics of Wall Street analysts’ consensus earnings estimates and recent revisions (up or down), quality and sustainability of reported earnings (forensic accounting), and various return ratios. It helps us predict relative performance over the next 1-3 months.
In addition, SectorCast computes a Bull Score and Bear Score for each ETF based on recent price behavior of the constituent stocks on particularly strong and weak market days. High Bull score indicates that stocks within the ETF recently have tended toward relative outperformance when the market is strong, while a high Bear score indicates that stocks within the ETF have tended to hold up relatively well (i.e., safe havens) when the market is weak.
Outlook score is forward-looking while Bull and Bear are backward-looking. As a group, these three scores can be helpful for positioning a portfolio for a given set of anticipated market conditions. Of course, each ETF holds a unique portfolio of stocks and position weights, so the sectors represented will score differently depending upon which set of ETFs is used. We use the iShares that represent the ten major U.S. business sectors: Financial (IYF), Technology (IYW), Industrial (IYJ), Healthcare (IYH), Consumer Goods (IYK), Consumer Services (IYC), Energy (IYE), Basic Materials (IYM), Telecommunications (IYZ), and Utilities (IDU). Whereas the Select Sector SPDRs only contain stocks from the S&P 500, I prefer the iShares for their larger universe and broader diversity. Fidelity also offers a group of sector ETFs with an even larger number of constituents in each.
Here are some of my observations on this week’s scores:
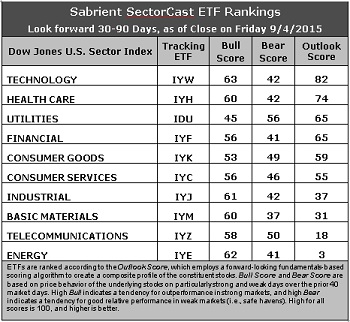
1. Technology makes return to the top spot this week with an Outlook score of 82, primarily due to net positive sentiment among Wall Street analysts (net revisions to earnings estimates). Although sentiment is nothing special, most of the other sectors have seen net negative revisions. Forward long-term growth rate, return ratios, and insider sentiment are strong, although the forward P/E is average (at 16x). Healthcare holds the second spot with a score of 74, followed by Utilities and Financial tied at 65. Utilities has a reasonably low forward P/E, but its growth rate is low. Financial has the lowest (attractive) forward P/E (at less than 14x). Consumer Goods rounds out the top five.
2. Energy remains at the bottom with an Outlook score of 3. The sector scores among the worst in all factors of the GARP model across the board. In particular, the sector still sports a negative forward long-term growth rate and low return ratios, as well as the highest forward P/E (about 22x), even after the huge price correction, and Wall Street continues to slash estimates. (Keep in mind, however, that the refining & marketing segment remains an area of strength within the sector.) Basic Materials has moved out of the bottom two, ahead of Telecom, which takes the other spot in the bottom two with an Outlook score of 18.
3. Looking at the Bull scores, Technology displays the top score of 63, followed by Energy and Industrial. Utilities is the lowest at 45. The top-bottom spread has widened to 18 points, which reflects relatively low sector correlations on particularly strong market days, which is good. It is generally desirable in a healthy market to see low correlations reflected in a top-bottom spread of at least 20 points, which indicates that investors have clear preferences in the stocks they want to hold (rather than broad risk-on behavior).
4. Looking at the Bear scores, Utilities displays the top score of 56, which means that stocks within this sector have been the preferred safe havens (relatively speaking) on weak market days. However, this score is down substantially from 73 just two weeks ago. Basic Materials scores the lowest at 37, as investors flee the sector during any sign of market weakness. The top-bottom spread is 19 points, which reflects low sector correlations on particularly weak market days, which is good. Ideally, certain sectors will hold up relatively well while others are selling off (rather than broad risk-off behavior), so it is generally desirable in a healthy market to see low correlations reflected in a top-bottom spread of at least 20 points.
5. Technology displays the best all-around combination of Outlook/Bull/Bear scores, while Energy is the worst. Looking at just the Bull/Bear combination, Telecom scores the highest, and it displays solid Bull/Bear balance, indicating superior relative performance (on average) in extreme market conditions (whether bullish or bearish), while Basic Materials and Financial are tied for the worst.
6. This week’s fundamentals-based Outlook rankings again look neutral. Although it is bullish to see Technology at the top followed by all-weather Healthcare and a solid score for Financial, it is less encouraging to see defensive sectors Utilities and Consumer Goods (Staples/Noncyclical) also in the top five ahead of Industrial. Moreover, our Net Revisors score, which reflects the mood of Wall Street analysts, continues to show very little in the way of positive earnings revisions. Keep in mind, the Outlook Rank does not include timing or momentum factors, but rather is a reflection of the fundamental expectations of individual stocks aggregated by sector.
Stock and ETF Ideas:
Our Sector Rotation model, which appropriately weights Outlook, Bull, and Bear scores in accordance with the overall market’s prevailing trend (bullish, neutral, or defensive), has reflected a defensive bias since August 20 and suggests holding Utilities, Consumer Goods (Staples/Noncyclical), and Consumer Services (Discretionary/Cyclical), in that order. (Note: In this model, we consider the bias to be defensive from a rules-based trend-following standpoint when SPY is below both its 50-day and 200-day simple moving averages.)
Other highly-ranked ETFs in SectorCast from the Utilities, Consumer Goods (Staples/Noncyclical), and Consumer Services (Discretionary/Cyclical) sectors include PowerShares S&P Small Cap Utilities Portfolio (PSCU), PowerShares S&P Small Cap Consumer Staples Portfolio (PSCC), and PowerShares Dynamic Leisure & Entertainment Portfolio (PEJ).
But overall, our rankings indicate that the best ETF bet right now might be the US Global Jets ETF (JETS), which is mostly airlines -- it scores a perfect 100 in its Outlook rank, plus solid scores in both its Bull and Bear ranks. Also rising to near the top of our ETF rankings is the First Trust Long Short Equity ETF (FTLS), which licenses our Earnings Quality Rank (a quant model we developed together with our forensic accounting subsidiary Gradient Analytics) for idea generation.
For an enhanced sector portfolio that enlists some top-ranked stocks (instead of ETFs) from within the top-ranked sectors, some long ideas from Utilities, Consumer Goods (Staples/Noncyclical), and Consumer Services (Discretionary/Cyclical) sectors include NextEra Energy (NEE), AGL Resources (GAS), Coca-Cola Bottling (COKE), Snyder’s-Lance (LNCE), The Priceline Group (PCLN), and NVR inc (NVR). All are highly ranked in the Sabrient Ratings Algorithm.
If you prefer to take a bullish bias, the Sector Rotation model suggests holding Technology, Healthcare, and Industrial, in that order. But if you prefer a neutral stance on the market, the model suggests holding Technology, Healthcare, and Utilities, in that order.
IMPORTANT NOTE: I post this information each week as a free look inside some of our institutional research and as a source of some trading ideas for your own further investigation. It is not intended to be traded directly as a rules-based strategy in a real money portfolio. I am simply showing what a sector rotation model might suggest if a given portfolio was due for a rebalance, and I may or may not update the information each week. There are many ways for a client to trade such a strategy, including monthly or quarterly rebalancing, perhaps with interim adjustments to the bullish/neutral/defensive bias when warranted -- but not necessarily on the days that I happen to post this weekly article. The enhanced strategy seeks higher returns by employing individual stocks (or stock options) that are also highly ranked, but this introduces greater risks and volatility. I do not track performance of the ETF and stock ideas mentioned here as a managed portfolio.
Disclosure: Author has no positions in stocks or ETFs mentioned.
Disclaimer: This newsletter is published solely for informational purposes and is not to be construed as advice or a recommendation to specific individuals. Individuals should take into account their personal financial circumstances in acting on any rankings or stock selections provided by Sabrient. Sabrient makes no representations that the techniques used in its rankings or selections will result in or guarantee profits in trading. Trading involves risk, including possible loss of principal and other losses, and past performance is no indication of future results.