Sector Detector: Europe Helps Launch Patriotic Rally in the U.S.
 Stocks have rallied since Friday, largely due to some promising developments out of Europe toward addressing their sovereign debt issues and shaky banks. As I said last week, global investors hoped for a sign of commitment from EU leaders at their latest summit to stimulate growth, create a banking union, and debt mutualization (e.g., Eurobonds). What they got was pretty close. And U.S. investors were cheered to see a healthy rally into our Independence Day holiday.
In fact, Germany’s shift away from its hard-line austerity position may have a market impact much like the Fed’s quantitative easing and the Troubled Asset Relief Program (TARP) of 2008. Spain’s 10-year bond yield has fallen back down below 6.5%, as creditors breathe a sigh of relief.
Also, you undoubtedly heard that the Supreme Court upheld the constitutionality of Obamacare, and the initial knee-jerk market reaction last Thursday was negative. But the market quickly reversed, and it has been strong ever since. The iShares Dow Jones U.S. Healthcare Sector ETF (IYH) hit a new 52-week high on Tuesday.
As the market closed out Q2, we see that it had some tough going in the wake of its big Q1. Stocks in the S&P 500 surged 12% during Q1, which was one of its strongest quarters in history. The SPY hit a high of 142.41 on April 2 before the Q2 correction kicked in. The iShares Dow Jones U.S. Energy Sector ETF (IYE) was a particularly weak-performing sector during Q2, and in fact the IYE now finds itself at the bottom of Sabrient’s SectorCast ETF rankings of the 10 U.S. sector iShares. Not surprisingly, defensive-oriented Utilities (IDU) was the top performer for Q2.
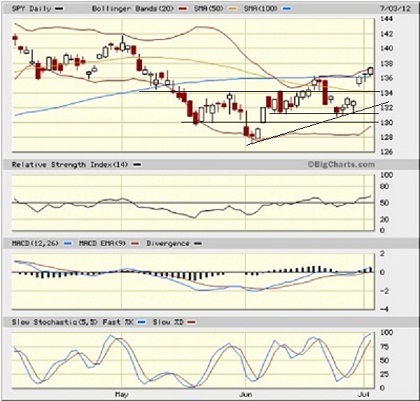
Looking at the SPY chart, it has made quite a bullish move, as I suggested might happen with its developing bullish ascending triangle pattern. SPY closed Tuesday at 137.4 and now it finds itself at its upper Bollinger Band and breaking out of the sideways channel and ascending triangle and above its 100-day simple moving average. RSI, MACD, and Slow Stochastic all look quite bullish.

The VIX (CBOE Market Volatility Index—a.k.a. “fear gauge”) closed Tuesday at 16.66. After a couple of tests of resistance at 20, it has fallen hard in conjunction with the market rally and confirms the bullishness in stocks.
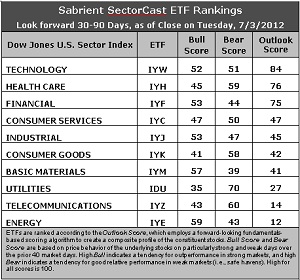
Latest rankings: The table ranks each of the ten U.S. industrial sector iShares (ETFs) by Sabrient’s proprietary Outlook Score, which employs a forward-looking, fundamentals-based, quantitative algorithm to create a bottom-up composite profile of the constituent stocks within the ETF. In addition, the table also shows Sabrient’s proprietary Bull Score and Bear Score for each ETF.
High Bull score indicates that stocks within the ETF have tended recently toward relative outperformance during particularly strong market periods, while a high Bear score indicates that stocks within the ETF have tended to hold up relatively well during particularly weak market periods. Bull and Bear are backward-looking indicators of recent sentiment trend.
As a group, these three scores can be quite helpful for positioning a portfolio for a given set of anticipated market conditions.

Observations:
1. Technology (IYW) retains the top spot with an Outlook score of 84 this week, followed once again by Healthcare (IYH) at 76. Financial (IYF) remains a close third at 75. The top three further increased their distance above the rest of the pack, with a 28-point gap down to fourth place Consumer Services (IYC). These rankings are reflective of an overall bullish bias, with the economically sensitive sectors like Technology, Financial, Consumer Services, and Industrial in the top five.
2. Energy (IYE) falls to the bottom of the Outlook rankings this week, as stocks within the sector have been slammed by analyst reductions in earnings estimates. Telecom (IYZ) remains in the bottom two, as it is saddled with the highest (worst) forward P/E and the worst return ratios.
3. Looking at the Bull scores, Energy (IYE) has emerged as the leader on strong market days, scoring 59 after excellent recent performance. Materials (IYM) is close behind at 57. Utilities (IDU) is still by far the weakest on strong days, scoring 34. In other words, Materials and Energy stocks have tended to perform the best when the market is rallying, while Utilities stocks have lagged.
4. Looking at the Bear scores, Utilities (IDU) remains the investor favorite “safe haven” on weak market days, scoring an impressive 70. Although Materials (IYM) and Energy (IYE) are the investor favorites on strong market days, they have been abandoned (relatively speaking) by investors during market weakness, as reflected by their low Bear scores of 39 and 43. In other words, Materials and Energy stocks have tended to sell off the most when the market is pulling back, while Utilities stocks have held up the best—just the opposite of the Bull scores.
5. Overall, IYW shows the best all-weather combination of Outlook/Bull/Bear scores. Adding up the three scores gives a total of 187. IYE is the worst at 114. IDU and IYH reflect the best combination of Bull/Bear at 104. Materials (IYM) displays the worst combination of Bull/Bear with an anemic 96.
These scores represent the view that the Technology and Healthcare sectors may be relatively undervalued overall, while Telecom and Energy sectors may be relatively overvalued, based on our 1-3 month forward look.
Top-ranked stocks within Technology and Healthcare sectors include Mellanox Technologies (MLNX), Cornerstone OnDemand (CSOD), MWI Veterinary Supply (MWIV), and United Therapeutics (UTHR).
Disclosure: Author has no positions in stocks or ETFs mentioned.
About SectorCast: Rankings are based on Sabrient’s SectorCast model, which builds a composite profile of each equity ETF based on bottom-up scoring of the constituent stocks. The Outlook Score employs a fundamentals-based multi-factor approach considering forward valuation, earnings growth prospects, Wall Street analysts’ consensus revisions, accounting practices, and various return ratios. It has tested to be highly predictive for identifying the best (most undervalued) and worst (most overvalued) sectors, with a one-month forward look.
Bull Score and Bear Score are based on the price behavior of the underlying stocks on particularly strong and weak days during the prior 40 market days. They reflect investor sentiment toward the stocks (on a relative basis) as either aggressive plays or safe havens. So, a high Bull score indicates that stocks within the ETF have tended recently toward relative outperformance during particularly strong market periods, while a high Bear score indicates that stocks within the ETF have tended to hold up relatively well during particularly weak market periods.
Thus, ETFs with high Bull scores generally perform better when the market is hot, ETFs with high Bear scores generally perform better when the market is weak, and ETFs with high Outlook scores generally perform well over time in various market conditions.
Of course, each ETF has a unique set of constituent stocks, so the sectors represented will score differently depending upon which set of ETFs is used. For Sector Detector, I use ten iShares ETFs representing the major U.S. business sectors.
About Trading Strategies: There are various ways to trade these rankings. First, you might run a sector rotation strategy in which you buy long the top 2-4 ETFs from SectorCast-ETF, rebalancing either on a fixed schedule (e.g., monthly or quarterly) or when the rankings change significantly. Another alternative is to enhance a position in the SPDR Trust exchange-traded fund (SPY) depending upon your market bias. If you are bullish on the broad market, you can go long the SPY and enhance it with additional long positions in the top-ranked sector ETFs. Conversely, if you are bearish and short (or buy puts on) the SPY, you could also consider shorting the two lowest-ranked sector ETFs to enhance your short bias.
However, if you prefer not to bet on market direction, you could try a market-neutral, long/short trade—that is, go long (or buy call options on) the top-ranked ETFs and short (or buy put options on) the lowest-ranked ETFs. And here’s a more aggressive strategy to consider: You might trade some of the highest and lowest ranked stocks from within those top and bottom-ranked ETFs, such as the ones I identify above.
