Sector Detector: Currency wars take the spotlight as stock investors must gauge which news is relevant
Much ado was made of China’s surprise 3% devaluation of their currency last week. But keep in mind, the yuan is pegged to the dollar, and with the dollar so strong, every major floating currency and commodity is down a lot more than that. Deflation is now a real threat. Then, there is the suddenly resolved issue of Greece’s debt (along with the worry of a domino-like fall of the entire Eurozone). Also, with earnings season drawing to a close, it is evident that both revenues and earnings are down from the same quarter last year, and yet about 70% of S&P 500 companies beat earnings expectations (albeit at a lowered bar). Overall, the lack of revenue growth combined with relatively high equity valuations (P/E multiple around 17x on the S&P 500) seems to indicate little room for stock price appreciation through rising multiples.
Yes, mixed signals abound, paralyzing investors. It can be hard to gauge which crisis is truly relevant and which is not. Nevertheless, equity valuations are not irrationally exuberant and given that stocks tend to price expectations for six months out, there is optimism that GDP and revenue growth will accelerate in the coming quarters. Moreover, where else are you going to invest your liquid assets? So, equities are neither selling off nor breaking out, and thus we continue to plod along with this historically lengthy consolidation period.
In this weekly update, I give my view of the current market environment, offer a technical analysis of the S&P 500 chart, review our weekly fundamentals-based SectorCast rankings of the ten U.S. business sectors, and then offer up some actionable trading ideas, including a sector rotation strategy using ETFs and an enhanced version using top-ranked stocks from the top-ranked sectors.
Market overview:
As the world's largest manufacturing nation, China consumes and stockpiles commodities of all sorts, so the threat of a slowing of its growth has hurt commodity prices, which were already falling due to the stronger dollar. China has long pegged its currency to the dollar, which was fine while the dollar was weak, but in this new strong-dollar era, The China Miracle of hyper-growth was suddenly threatened, and thus they felt the need to manually do what the market cannot. For comparison, over the same period (since 10/31/2014) that the yuan has fallen -3.5%, the yen is down more than -17%, the euro -16%, the Canadian dollar -16%, and the peso -20%.
No, despite what the doomsayers would have you believe, the dollar’s status as the world’s reserve currency isn’t going away anytime soon. In fact, its strength becomes self-perpetuating as it becomes even more of a magnet for plentiful global liquidity looking for both safety and stability (i.e., both return of capital and return on capital).
China, on the other hand, seems to be suspected by both the Chinese and global investors to be a house-of-cards, kept aloft by unbridled growth magically engineered by the political elite, producing massive amounts of cash for the well-connected in search of safe haven investments abroad. (And there is certainly no shortage of young Chinese students driving Maserati’s while attending California colleges.) Much of this cash is flowing into U.S. Treasuries and real estate.
Witness the 10-year Treasury yield closing Friday at 2.20% and the 30-year at 2.84%. The Fed finds itself in the awkward position of desperately wanting to begin the process of normalizing the short-term fed funds rate, but risking further strengthening of the dollar (to the detriment of corporate earnings and commodity prices) and further flattening the yield curve. (Of course, the Fed holds over $2 trillion in long-dated bonds and notes from its QE programs that could be unwound if necessary to push up those longer-term yields. After all, those assets will need to be unwound eventually.)
As you recall, last fall Japan launched into an aggressive QE that quickly led to a global currency war (race to debase) and to other central banks’ policies that tend to overshoot their intended targets. In turn, global stock investors have responded by driving up equity prices by huge amounts in their local currencies. Winners have included stock markets in China, Ireland, Denmark, Israel, Japan, Hungary, Italy, Germany, France, Netherlands, and Belgium, while the losers have included stock markets in Saudi Arabia, Canada, Thailand, Chile, Australia, Mexico, Indonesia, Greece, Brazil, and Colombia. Notably, Russia has seen mixed returns, with equity markets up +18% in local rubles but down -25% when converted to US dollars (as the ruble has weakened by about 43% against the dollar since the new currency wars essentially began on 10/31/2014).
How does this all impact us here in the U.S.? Of course, as consumers, our strong dollars are buying a lot more on the world scale. Commodity prices (including oil, or course) are low, and imports are increasingly affordable. But the flip side is that our large multinationals are struggling with the headwinds of selling into overseas markets, with revenues in local currencies being repatriated into fewer dollars, which inhibits top-line growth.
On the other hand, small caps that sell mostly into domestic markets can thrive, at least in theory. The problem, however, is that the economy is broad and intertwined, and large cap multinationals that use small cap vendors may choose to cut back on purchases. Apple (AAPL) is one example, and concerns about its sales into China has pushed down some terrific semiconductor firms like Sabrient favorites Skyworks Solutions (SWKS), Avago Technologies (AVGO), and Qorvo (QRVO), which are some of its top suppliers. So, things are not so clear-cut. You still have to pick and choose.
The CBOE Market Volatility Index (VIX), a.k.a. fear gauge, closed last Friday at 12.83, and remains well below the 15 fear threshold and well below the 20 panic threshold that has held as resistance throughout the summer. There’s no immediate indication of imminent panic selling, but also no apparent catalyst to turn such complacency into higher prices.
Furthermore, with market leadership and breadth so narrow, the need for skilled stock-picking from among the highest quality companies is paramount – that is, those having a solid business model, products that dominate their space and a strong product pipeline, improving margins and organic growth, and attractive forward valuation for strong (and realistic) growth expectations, as well as solid earnings quality and conservative accounting practices, including strong balance sheet, free cash flow, and cash on hand.
On that note, last week we launched our first mid-year version of our Baker’s Dozen top picks list based on our proven growth-at-a-reasonable-price (aka, GARP) model. Like the January portfolio (which we have been publishing since 2009), it is being offered as a unit investment trust by First Trust Portfolios.
SPY chart review:
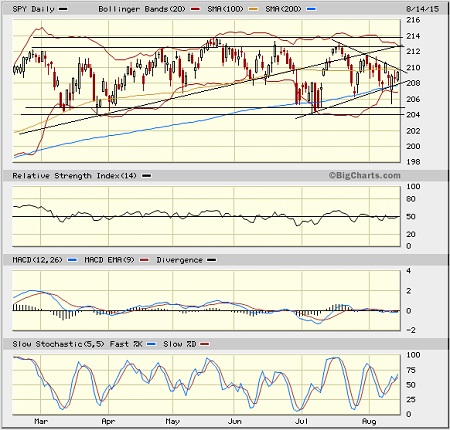
The SPDR S&P 500 Trust (SPY) closed Friday at 209.42. The long-standing bullish uptrend line shown (which has essentially been in place since late-September 2011) has given way as of the end of June, with a brief attempt in July to recover it. Now it appears to be forming something of a neutral pennant, with a new breakout or breakdown likely imminent. The 50-day and 100-day simple moving averages have converged around 210, and the 200-day is not far below near 208. Friday provided a bullish engulfing candlestick pattern, but oscillators RSI, MACD, and Slow Stochastic remain in a somewhat neutral position that still could go either way. Major support is just below at the critical 200-day SMA (which is still rising bullishly), followed by recent support around 204-205, then round-number support at the 200 price level. This historic sideways consolidation period (ever since the February bounce to new highs) appears to be bounded by 204-205 on the bottom and 212-214 at the top, and so price remains right in the middle with no clear indication as to direction. My guess would be to the upside.
After peering over the edge of a mighty cliff, the small cap iShares Russell 2000 ETF (IWM) offered up a bullish engulfing candle on Friday, and oscillators RSI, MACD, and Slow Stochastics are all pointing up bullishly, indicating that we might see a bounce up to retest support-turned-resistance at the 200-day SMA.
Latest sector rankings:
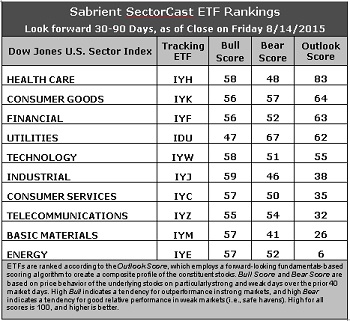
Relative sector rankings are based on our proprietary SectorCast model, which builds a composite profile of each equity ETF based on bottom-up aggregate scoring of the constituent stocks. The Outlook Score employs a forward-looking, fundamentals-based multifactor algorithm considering forward valuation, historical and projected earnings growth, the dynamics of Wall Street analysts’ consensus earnings estimates and recent revisions (up or down), quality and sustainability of reported earnings (forensic accounting), and various return ratios. It helps us predict relative performance over the next 1-3 months.
In addition, SectorCast computes a Bull Score and Bear Score for each ETF based on recent price behavior of the constituent stocks on particularly strong and weak market days. High Bull score indicates that stocks within the ETF recently have tended toward relative outperformance when the market is strong, while a high Bear score indicates that stocks within the ETF have tended to hold up relatively well (i.e., safe havens) when the market is weak.
Outlook score is forward-looking while Bull and Bear are backward-looking. As a group, these three scores can be helpful for positioning a portfolio for a given set of anticipated market conditions. Of course, each ETF holds a unique portfolio of stocks and position weights, so the sectors represented will score differently depending upon which set of ETFs is used. We use the iShares that represent the ten major U.S. business sectors: Financial (IYF), Technology (IYW), Industrial (IYJ), Healthcare (IYH), Consumer Goods (IYK), Consumer Services (IYC), Energy (IYE), Basic Materials (IYM), Telecommunications (IYZ), and Utilities (IDU). Whereas the Select Sector SPDRs only contain stocks from the S&P 500, I prefer the iShares for their larger universe and broader diversity. Fidelity also offers a group of sector ETFs with an even larger number of constituents in each.
Here are some of my observations on this week’s scores:
1. Healthcare remains in the top spot with an Outlook score of 83, primarily due to highly favorable sentiment among Wall Street analysts (net upward revisions to earnings estimates), solid return ratios, and a strong forward long-term growth rate, although its forward P/E remains pricey. Consumer Goods (Staples/Noncyclical) moves into second place with a score of 64, but it is tightly bunched with Financial and Utilities with scores of 63 and 62. Technology rounds out the top five, and these are the only ones scoring above 50.
2. Energy remains at the bottom with an Outlook score of 6. Energy scores poorly in most factors of the GARP model across the board. In particular, Wall Street continues to slash estimates, and yet the sector still displays by far the highest forward P/E and a negative forward long-term growth rate. Basic Materials takes the other spot in the bottom two with a 26. Even though the sector displays one of the lowest forward P/Es, Wall Street continues to slash forward earnings estimates as commodity prices continue to struggle.
3. Looking at the Bull scores, Industrial displays the top score of 58, followed by Healthcare and Technology. Energy saw its Bull score jump to 57. Utilities is the lowest at 47. The top-bottom spread is only 11 points, still reflecting high sector correlations on particularly strong market days (i.e., broad risk-on buying). It is generally desirable in a healthy market to see low correlations reflected in a top-bottom spread of at least 20 points, which indicates that investors have clear preferences in the stocks they want to hold.
4. Looking at the Bear scores, Utilities displays the top score of 67, which means that stocks within this sector have been the preferred safe havens (relatively speaking) on weak market days. Basic Materials scores the lowest at 41. The top-bottom spread is a robust 26 points, which reflects quite low sector correlations on particularly weak market days, which is good. Ideally, certain sectors will hold up relatively well while others are selling off, so it is generally desirable in a healthy market to see low correlations reflected in a top-bottom spread of at least 20 points.
5. Healthcare displays the best all-around combination of Outlook/Bull/Bear scores, while Energy is the worst. Looking at just the Bull/Bear combination, Utilities scores the highest, but Consumer Goods (Staples/Noncyclical) is close behind and has the best Bull/Bear balance, indicating superior relative performance (on average) in extreme market conditions (whether bullish or bearish), while Basic Materials is by far the worst.
6. After looking defensive last week, this week’s fundamentals-based Outlook rankings appear to be back to neutral. Although all-weather Healthcare tops the list, with defensive sectors Utilities and Consumer Goods (Staples/Noncyclical) also in the top four, Financial is clawing its way back up. Basic Materials and Energy are mired at the bottom due to expected persistence of low commodities prices. It looks like a 3-tier ranking, with Healthcare by itself at the top. Keep in mind, the Outlook Rank does not include timing or momentum factors, but rather is a reflection of the fundamental expectations of individual stocks aggregated by sector.
Stock and ETF Ideas:
Our Sector Rotation model, which appropriately weights Outlook, Bull, and Bear scores in accordance with the overall market’s prevailing trend (bullish, neutral, or defensive), still reflects a neutral bias and suggests holding Healthcare, Consumer Goods (Staples/Noncyclical), and Financial, in that order. (Note: In this model, we consider the bias to be neutral from a rules-based trend-following standpoint when SPY is below its 50-day but still above its 200-day simple moving average.)
Other highly-ranked ETFs in SectorCast from the Healthcare, Consumer Goods (Staples/Noncyclical), and Financial sectors include iShares Global Healthcare ETF (IXJ), PowerShares DWA Consumer Staples Momentum Portfolio (PSL), and First Trust NASDAQ ABA Community Bank Index Fund (QABA). Notably, the two equity ETFs with the highest Outlook scores in our system are both heavily weighted in airlines -- the SPDR S&P Transportation ETF Trust (XTN) and the US Global Jets ETF (JETS).
For an enhanced sector portfolio that enlists some top-ranked stocks (instead of ETFs) from within the top-ranked sectors, some long ideas from Healthcare, Consumer Goods (Staples/Noncyclical), and Financial sectors include United Health Services (UHS), Hospira (HSP), Hormel Foods (HRL), Casey’s General Stores (CASY), Signature Bank (SBNY), and Home Bancshares (HOMB). All are highly ranked in the Sabrient Ratings Algorithm.
If you prefer to take a bullish bias, the Sector Rotation model suggests holding Healthcare, Technology, and Industrial, in that order. But if you prefer a defensive stance on the market, the model continues to suggest holding Utilities, Consumer Goods (Staples/Noncyclical), and Healthcare, in that order.
IMPORTANT NOTE: I post this information each week as a free look inside some of our institutional research and as a source of some trading ideas for your own further investigation. It is not intended to be traded directly as a rules-based strategy in a real money portfolio. I am simply showing what a sector rotation model might suggest if a given portfolio was due for a rebalance, and I may or may not update the information each week. There are many ways for a client to trade such a strategy, including monthly or quarterly rebalancing, perhaps with interim adjustments to the bullish/neutral/defensive bias when warranted -- but not necessarily on the days that I happen to post this weekly article. The enhanced strategy seeks higher returns by employing individual stocks (or stock options) that are also highly ranked, but this introduces greater risks and volatility. I do not track performance of the ETF and stock ideas mentioned here as a managed portfolio.
Disclosure: Author has no positions in stocks or ETFs mentioned.
Disclaimer: This newsletter is published solely for informational purposes and is not to be construed as advice or a recommendation to specific individuals. Individuals should take into account their personal financial circumstances in acting on any rankings or stock selections provided by Sabrient. Sabrient makes no representations that the techniques used in its rankings or selections will result in or guarantee profits in trading. Trading involves risk, including possible loss of principal and other losses, and past performance is no indication of future results.