Sector Detector: Bulls try to find a backbone in the face of fear and loathing
Investors find themselves paralyzed by uncertainty given mixed messages from prominent market experts and talking heads, some professing the sorry and deteriorating state of the global economy, and others cheerleading the continued improvement in the fundamentals, particularly here in the U.S. Indeed, the nearly identical chart of the S&P 500 in 2015 compared to 2011 gave hope to a similarly solid start to 2016 as we saw in 2012, but instead we have seen the worst start to a New Year in history.
It is no wonder financial advisors everywhere, with most of the their books belonging to older investors who worry more about return OF capital rather than return ON capital, are scrambling to interpret the morass. They know from experience that knee-jerk reactions to such market disarray often produce the exact wrong decisions, abandoning carefully structured financial plans at exactly the wrong time. As FDR famously said, “The only thing we have to fear is fear itself,” and I believe that is true today for U.S. investors as the smoke signals seem to point more to improving rather than deteriorating fundamentals. The best investment opportunities often occur when fear is rampant, while bubbles occur when things are just too darn rosy.
In this weekly update, I give my view of the current market environment, offer a technical analysis of the S&P 500 chart, review our weekly fundamentals-based SectorCast rankings of the ten U.S. business sectors, and then offer up some actionable trading ideas, including a sector rotation strategy using ETFs and an enhanced version using top-ranked stocks from the top-ranked sectors.
Market overview:
The headlines have been scary, no doubt. And there are many high-profile fund managers and market commentators with impressive pedigrees with convincing arguments as to why the global economy is doomed to implosion. I got an email the other day titled “The Dying Gasps of Bubble Finance,” saying that global economic growth has been all smoke and mirrors from central bank largesse. The meetings in Davos have produced a feeling of now-or-never when it comes to saving the global economy from the collapse of China and emerging markets, as China’s total debt has risen to 280% of GDP, and emerging markets aren’t far behind. Moreover, Brazil is on the verge of collapse even as it prepares to host the Summer Olympics. Oil prices continue to languish, even briefly falling below $30/bbl. Corporate earnings are in recession. Credit spreads are widening. Ever-morphing Islamic terrorism has the population on edge. None of the Presidential contenders evokes public confidence. The list goes on.
None of this is new, and indeed last year these issues led to a fearful, headline-driven trader’s market during which stocks demonstrated extraordinarily narrow market breadth, particularly after small caps hit their peak on June 23. To illustrate, just look at the performance difference of the large-cap, cap-weighted SPDR S&P 500 Trust (SPY) versus the small-cap, equal-weighted Guggenheim Russell 2000 Equal Weight ETF (EWRS). Since June 23, SPY fell -9.5% through last Friday while EWRS fell a whopping -25.1%. That’s a nearly 16% performance differential for the cap-weighted large caps over the equal-weighted small caps. Just incredible. And now the start to 2016 has been downright frightening.
But here’s the thing. There is no one (with the possible exception of ISIS) who wants to see the global economy collapse. It is all hands on deck around the world (including governments, central banks, corporations, and small businesses) when it comes to ensuring economic growth and stability. Sure, you can debate the effectiveness of certain tactics being implemented, but ultimately we are all in this together with a common goal of prosperity.
Keep in mind, China just reported 6.9% real GDP growth, and their government will do pretty much anything necessary to ensure continued growth. In addition, both the BOJ and the ECB are suggesting more QE stimulus. As for further rate hikes here in the U.S., Fed Funds Futures are now discounting just one rate hike from the Fed in 2016, if any, as compared to the four rate hikes signaled by the Fed’s dot plot back in December. Unemployment continues to fall. Bond rates remain low, which supports higher equity valuations. And as for inflation, technological advances are inherently deflationary by increasing efficiency and productivity, so perhaps the Fed’s 2% target is outdated.
The 10-year Treasury yield closed Friday at 2.05% after briefly falling below 2% during a general flight to safety, while risk assets like stocks followed oil prices lower. The spread between 2- and 10-year U.S. Treasuries fell to 1.16 last week, which is a 5-year low and a strong signal that savvy bond investors are concerned about economic growth, although it is not so low as to be pricing in a recession. In comparison, the dividend yield on the S&P 500 is now around 2.30%.
The CBOE Market Volatility Index (VIX), a.k.a. fear gauge, closed the year at 22.34, which is above the 20 panic threshold, but we are likely moving into a period of elevated volatility that might move the VIX range higher from the historically low levels it has been trading for the past few years. This week, market-moving news may arise from the busiest week of earnings reports as well as the latest FOMC announcement.
From a macro perspective, there is plenty of ammunition for both bulls and bears to make a convincing case. But here at Sabrient, although we each have our own opinions, our underlying models are rules-based and rely not upon the macro ruminations of deep-thinkers but upon the broad consensus among the many Wall Street research analysts who cover the individual companies and their industries, sales pipelines, channel checks, competitive environment, and business outlook from those with boots on the ground. From this micro perspective, there is reason for optimism this year. Our top-ranked sectors include Technology, Healthcare, Financial, and Consumer.
As corporations, investors, and consumers come to terms with our transition out of ZIRP era and the resulting rise in volatility, we expect this current flight to safety to evolve into a flight back to quality, including value, GARP (growth at reasonable price), and dividend strategies, which have all struggled mightily, especially since last June. A flight to quality means that “FANG” investing (Facebook, Amazon, Netflix, Google) should underperform. Low 10-year yields will likely persist, probably not exceeding 3% this year, which supports higher equity multiples. After an extended period of EPS growth relying upon productivity gains and stock buyback programs (facilitated by ZIRP and QE), further EPS growth will depend upon top-line growth from capital investment. It is likely that Energy and Basic Materials sectors will stabilize after an extended period of freefall, but not necessarily grow. And a recession here in the U.S. seems unlikely. In fact, with low unemployment, hints of wage inflation, low energy prices padding the average consumer’s wallet, and solid retail sales, the strength of the global economy rests right here at home on Main Street.
Thus, it comes as no surprise that Sabrient’s eighth annual Baker’s Dozen top 13 picks for 2016, which is underlain by an unbiased quantitative GARP model, comprises stocks from various sectors but with the common thread that they produce goods and services that can be directly consumed by individuals -- including airlines, cruise line, auto maker, drug makers, discount retailers, cell phone service, banking, software, and gaming.
SPY chart review:
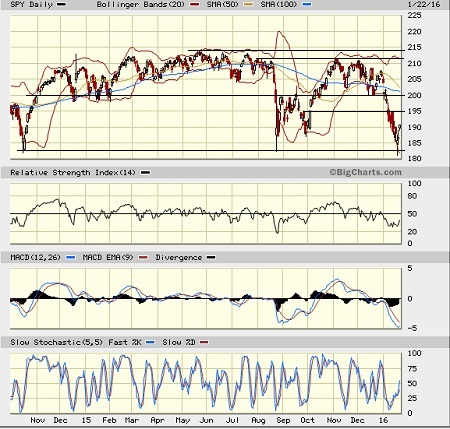
The SPDR S&P 500 Trust (SPY) closed on Friday at 190.52 after retesting and bouncing from the August lows. As I have observed before, the full year chart looks virtually identical to 2011. However, the start to the subsequent year hasn’t worked out quite same this year as it did in 2012. SPY remains below all of its key moving averages, including the 20-day, 50-day, 100-day, and 200-day simple moving averages (note that the 100 and 200 have converged together and now sit at about 201). Previous support levels have failed, and technical formations that seemed to have been forming have all fallen apart, and now a triple bottom is being tested at a critical support level around 182.5 dating back to October 2014 and August 2015. Oscillators RSI, MACD, and Slow Stochastic are all bouncing from deeply oversold levels, albeit on falling volume. Price should continue higher, perhaps to test support turned resistance at 195. If investors can shake off their inordinate fear and turn this back into a quality-driven rather than headline-driven market, bulls might have a chance at taking stock higher from here. Otherwise, there is a risk of further downside.
Latest sector rankings:
Relative sector rankings are based on our proprietary SectorCast model, which builds a composite profile of each equity ETF based on bottom-up aggregate scoring of the constituent stocks. The Outlook Score employs a forward-looking, fundamentals-based multifactor algorithm considering forward valuation, historical and projected earnings growth, the dynamics of Wall Street analysts’ consensus earnings estimates and recent revisions (up or down), quality and sustainability of reported earnings (forensic accounting), and various return ratios. It helps us predict relative performance over the next 1-3 months.
In addition, SectorCast computes a Bull Score and Bear Score for each ETF based on recent price behavior of the constituent stocks on particularly strong and weak market days. High Bull score indicates that stocks within the ETF recently have tended toward relative outperformance when the market is strong, while a high Bear score indicates that stocks within the ETF have tended to hold up relatively well (i.e., safe havens) when the market is weak.
Outlook score is forward-looking while Bull and Bear are backward-looking. As a group, these three scores can be helpful for positioning a portfolio for a given set of anticipated market conditions. Of course, each ETF holds a unique portfolio of stocks and position weights, so the sectors represented will score differently depending upon which set of ETFs is used. We use the iShares that represent the ten major U.S. business sectors: Financial (IYF), Technology (IYW), Industrial (IYJ), Healthcare (IYH), Consumer Goods (IYK), Consumer Services (IYC), Energy (IYE), Basic Materials (IYM), Telecommunications (IYZ), and Utilities (IDU). Whereas the Select Sector SPDRs only contain stocks from the S&P 500, I prefer the iShares for their larger universe and broader diversity. Fidelity also offers a group of sector ETFs with an even larger number of constituents in each.
Here are some of my observations on this week’s scores:
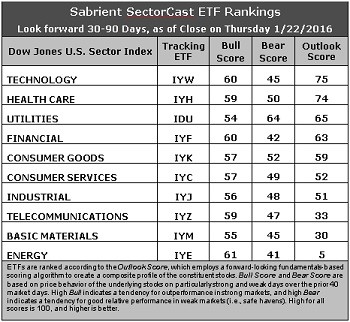
1. Technology has taken the top spot with an Outlook score of 75, but it is in a virtual tie with Healthcare at 74. Technology displays solid factor scores across the board, including the highest forward long-term growth rate and solid sentiment among Wall Street sell-side analysts (net revisions to earnings estimates). Healthcare also has good factor scores across the board. Utilities comes in third at 65, primarily because of its stable earnings, i.e, not much in the way of downward earnings revisions (but not much expected growth, either). Financial has slipped to the fourth spot this week with an Outlook score of 63 as sell-side analysts have cut forward earnings estimates, perhaps due to an evolving view about a flattening yield curve and the ability of banks to earn more money. Still, Financial sports the lowest forward P/E (12.9x). Then next three are all bunched together with scores in the 50s: Consumer Goods (Staples/Noncyclical), Consumer Services (Discretionary/Cyclical), and Industrial (which includes the strong Airlines industry).
2. Energy remains mired at the bottom with an Outlook score of 5 as the sector scores the absolute worst in all factors of the GARP model, including an increasingly negative forward long-term growth rate (as oil prices hit lower lows) and the highest forward P/E (23.5x). Basic Materials and Telecom are in a virtual dead heat for the other spot in the bottom two with an Outlook score of 30 and 33, respectively, as both still display elevated forward P/Es.
3. Looking at the Bull scores, Energy tops the list with a 61, followed closely by Technology and Financial, while Utilities is the lowest at 54. The top-bottom spread is only 7 points, which reflects high sector correlations on strong market days, which is not so good for stock picking. It is generally desirable in a healthy market to see low correlations reflected in a top-bottom spread of at least 20 points, which indicates that investors have clear preferences in the stocks they want to hold (rather than broad risk-on behavior).
4. Looking at the Bear scores, Utilities (as usual) displays the top score of 64, which means that stocks within this sector have been the preferred safe havens (relatively speaking) on weak market days. Energy scores the lowest at 41, followed closely by Financial, as investors flee during market weakness. The top-bottom spread is 23 points, which reflects low sector correlations on weak market days, which is good for stock picking. Ideally, certain sectors will hold up relatively well while others are selling off (rather than broad risk-off behavior), so it is generally desirable in a healthy market to see low correlations reflected in a top-bottom spread of at least 20 points.
5. Healthcare and Utilities display the best all-around combination of Outlook/Bull/Bear scores, followed closely by Technology, while Energy is by far the worst. However, looking at just the Bull/Bear combination, Utilities is the best (perhaps due to a renewed investor appetite for dividends), indicating superior relative performance (on average) in extreme market conditions (whether bullish or bearish), while Basic Materials is the worst.
6. This week’s fundamentals-based Outlook rankings still look mostly neutral, but there are signs of bullishness creeping in. Healthcare is somewhat all-weather (so it’s not a strong indicator either way of bullish or defensive sentiment), but economically sensitive Technology at the top and Financial at number four is bullish, while defensive sectors Utilities and Consumer Goods (Staples/Noncyclical) in the top five is typically less bullish. So, it’s kind of a stalemate between bulls and bears at the top of the rankings, but it is encouraging to see Consumer Services (Discretionary/Cyclical) and Industrial scoring above 50. Perhaps the rankings are trying to tell us that there is some reason for optimism in our future. Keep in mind, the Outlook Rank does not include timing, momentum, or relative strength factors, but rather is a reflection of the fundamental expectations of individual stocks aggregated by sector.
Stock and ETF Ideas:
Our Sector Rotation model, which appropriately weights Outlook, Bull, and Bear scores in accordance with the overall market’s prevailing trend (bullish, neutral, or defensive), still reflects a defensive bias (no surprise given that over 80% of stocks are below their 200-day simple moving average) and suggests holding Utilities, Healthcare, and Consumer Goods (Staples/Noncyclical), in that order. (Note: In this model, we consider the bias to be defensive from a rules-based trend-following standpoint when SPY is below both its 50-day and 200-day simple moving averages.)
Other highly-ranked ETFs in SectorCast from the Utilities, Healthcare, and Consumer Goods (Staples/Noncyclical) sectors include Guggenheim Invest S&P 500 Equal Weight Utilities ETF (RYU), Market Vectors Pharmaceutical ETF (PPH), and PowerShares DWA Consumer Staples Momentum Portfolio (PSL).
Other notable ETFs that are highly ranked in our quant model include US Global Jets ETF (JETS), which has been consistently top-ranked and mostly comprises airlines. The forward P/E among airlines is extraordinarily low for solid expected growth, mainly because the airline industry was historically known for making all the wrong decisions at the wrong time, taking on debt, increasing capacity, and getting into price wars leading to restructuring, bankruptcies, and consolidations, but they seem to be getting smarter about it, tacking on fees for bags, movies, and drinks, streamlining operations, adhering to strict cost control and fuel efficiency, and some even operating their own refineries.
Other top-ranked ETFs include PowerShares Dynamic Leisure & Entertainment Portfolio (PEJ), Global X SuperDividend US ETF (DIV), Market Vectors Solar Energy ETF (XAR), and Direxion All Cap Insider Sentiment Shares (KNOW), which tracks a Sabrient index based on insider buying activity and sell-side analysts’ upward revisions to earnings estimates.
For an enhanced sector portfolio that enlists some top-ranked stocks (instead of ETFs) from within the top-ranked sectors, some long ideas from Utilities, Healthcare, and Consumer Goods (Staples/Noncyclical) sectors include American Water Works (AWK), WGL Holdings (WGL), Valeant Pharmaceuticals (VRX), Mylan NV (MYL), Constellation Brands (STZ), and Casey’s General Stores (CASY). All are highly ranked in the Sabrient Ratings Algorithm.
If you prefer to take a neutral bias, the Sector Rotation model suggests holding Technology, Healthcare, and Utilities, in that order. On the other hand, if you prefer a bullish stance on the market, the model suggests holding Technology, Financial, and Healthcare, in that order.
IMPORTANT NOTE: I post this information periodically as a free look inside some of our institutional research and as a source of some trading ideas for your own further investigation. It is not intended to be traded directly as a rules-based strategy in a real money portfolio. I am simply showing what a sector rotation model might suggest if a given portfolio was due for a rebalance, and I may or may not update the information each week. There are many ways for a client to trade such a strategy, including monthly or quarterly rebalancing, perhaps with interim adjustments to the bullish/neutral/defensive bias when warranted -- but not necessarily on the days that I happen to post this weekly article. The enhanced strategy seeks higher returns by employing individual stocks (or stock options) that are also highly ranked, but this introduces greater risks and volatility. I do not track performance of the ETF and stock ideas mentioned here as a managed portfolio.
Disclosure: Author has no positions in stocks or ETFs mentioned.
Disclaimer: This newsletter is published solely for informational purposes and is not to be construed as advice or a recommendation to specific individuals. Individuals should take into account their personal financial circumstances in acting on any rankings or stock selections provided by Sabrient. Sabrient makes no representations that the techniques used in its rankings or selections will result in or guarantee profits in trading. Trading involves risk, including possible loss of principal and other losses, and past performance is no indication of future results.