Sector Detector: Bulls start their move into cyclicals
 The S&P 500 is up 14.5% year-to-date through Wednesday, and the defensive sectors like healthcare, consumer staples, and utilities have done even better. But so far in May, the leaders have been industrials, consumer discretionary, energy, materials, financial, and technology. I said last week that new highs were on the horizon, but that a rotation into economically-sensitive sectors, and from value into growth, would be needed to provide fuel for the next leg up. Such a rotation appears to have begun, and the major averages have indeed broken out to new highs.
To be sure, many market commentators have been screaming that a major correction is imminent. And the higher the bulls take it, the worse it will fall, they say. Also, consider that over the past 23 years, the Dow has reverted back to its January opening value at least once during each of those years, and 20 of those years saw a decline greater than 5%.
But this time might be different. I know, I know, those are famous last words. But stocks have consistently demonstrated the ability to simply churn in place to work off overbought conditions. Furthermore, consider that the market has been driven so far this year by a collaboration of reluctant bulls unhappy with the alternatives to stocks, bond refugees seeking higher income, a generally positive trajectory in the economic reports, and corporate stock buyback programs driven by the Fed’s cheap money. So, this might be just the start of a real “risk on” allocation of new investment capital into cyclicals.
If so, that’s a healthy sign of investor confidence in the US economy and in the stock market as a place to invest for the longer term. Even better, investors appear to be a broadening into cyclical sectors rather than rotating. The defensive sectors are holding up even with their lofty valuations, while the cyclicals are rising. Because defensive stocks generally offer a reasonable yield, we won’t necessarily see money flee those sectors. It all looks bullish for stocks.
Looking at the chart of the SPY, it closed Wednesday at 163.34. After a couple of tries during April at breaking through psychological resistance at 160, SPY indeed broke out with gusto. The catalyst was encouraging reports on jobs and unemployment. Oscillators like RSI, MACD, and Slow Stochastic all made a sharp reversal back up after looking like they were rolling over.
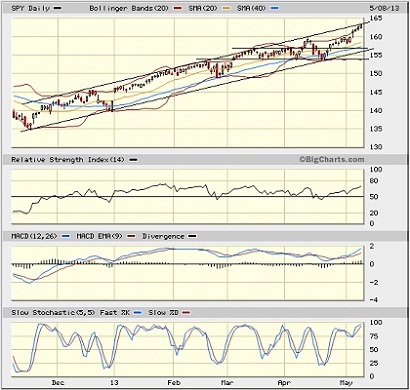
Now SPY is definitely looking extended. It is at the top line of a bullish rising channel that has been in place since the November lows, and far above its 20-day simple moving averages. Bollinger Bands are quite wide, and RSI, MACD, and Slow Stochastic are all overbought. A mean reversion to the 20-day SMA is likely, but that’s well within the rising channel, and would certainly be taken by bulls as yet another buying opportunity.
The CBOE Market Volatility Index (VIX), a.k.a. “fear gauge,” closed Wednesday at 12.66, which is quite low and confirms the bulls’ conviction.
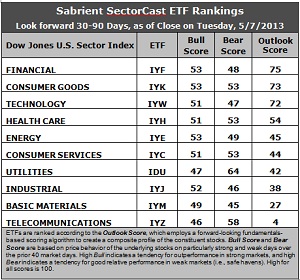
Latest rankings: The table ranks each of the ten U.S. business sector iShares ETFs by Sabrient's proprietary Outlook Score, which employs a forward-looking, fundamentals-based, quantitative algorithm to create a bottom-up composite profile of the constituent stocks within the ETF. The multi-factor model considers forward valuation, historical earnings trends, earnings growth prospects, the dynamics of Wall Street analysts' consensus estimates, accounting practices and earnings quality, and various return ratios. In addition, the table also shows Sabrient's proprietary Bull Score and Bear Score for each ETF.
High Bull score indicates that stocks within the ETF have tended recently toward relative outperformance during particularly strong market periods, while a high Bear score indicates that stocks within the ETF have tended to hold up relatively well during particularly weak market periods. Bull and Bear are backward-looking indicators of recent sentiment trend.
As a group, these three scores can be quite helpful for positioning a portfolio for a given set of anticipated market conditions.
Observations:
1. Financial (IYF) takes the top ranking this week with an Outlook score of 75, but the top three are essentially in a dead heat. Defensive sector Consumer Goods (IYK) scores a 73 and Technology (IYW) comes in at 72. IYF displays strong sentiment among Wall Street analysts and insiders, as well as a low forward P/E. Stocks within IYK have enjoyed the best support from Wall Street (i.e., net upgrades in forward earnings estimates) and strong return ratios, although valuations are getting high.
2. Telecom (IYZ) stays in the cellar with an Outlook score of 4. It is weak in forward P/E, long-term projected growth, and trailing return ratios, although it has enjoyed a resurgence in Wall Street upgrades. It is joined in the bottom two again this week by Basic Materials (IYM), which is seeing a continued acceleration in Wall Street earnings downgrades.
3. Despite some shuffling, this week’s fundamentals-based rankings are similar to last week’s in that I would call the bias slightly to the bullish side of neutral. Industrial (IYJ) fell while Energy (IYE) rose.
4. Looking at the Bull scores, IYF, IYK, and IYE are tied as the leaders on particularly strong market days, scoring 53, followed closely by IYJ, while IYZ is the laggard on strong market days, scoring 46. The narrow top-bottom spread is only 7 points, which continues to indicate high sector correlation on strongly bullish days.
5. Looking at the Bear scores, Utilities (IDU) is serving as the favorite “safe haven” on weak market days, scoring 64, while Materials (IYM) is the worst during extreme market weakness as reflected in its low Bear score of 45. The top-bottom spread is 19 points, which continues to indicate lower correlations on weak market days, i.e., it pays to be in the safe sectors when the market is bearish.
6. Overall, Consumer Goods (IYK) shows the best all-weather combination of Outlook/Bull/Bear scores. Adding up the three scores gives a total of 179. Telecom (IYM) is the worst at 108. Looking at just the Bull/Bear combination, Utilities (IDU) shows an impressive total score of 111. Materials (IYM) displays the lowest score at 94. This indicates that Utilities stocks have performed the best in extreme market conditions (whether bullish or bearish) while Materials stocks are avoided altogether.
These Outlook scores represent the view that Financial and Consumer Goods sectors may be relatively undervalued, while Telecom and Basic Materials sectors may be relatively overvalued based on our 1-3 month forward look.
Some top-ranked stocks within IYF and IYK include Franklin Resources (BEN), The Chubb Corp (CB), Mohawk Industries (MHK), and Bunge Limited (BG).
Disclosure: Author has no positions in stocks or ETFs mentioned.
About SectorCast: Rankings are based on Sabrient’s SectorCast model, which builds a composite profile of each equity ETF based on bottom-up aggregate scoring of the constituent stocks. The Outlook Score employs a fundamentals-based multi-factor approach considering forward valuation, earnings growth prospects, Wall Street analysts’ consensus revisions, accounting practices, and various return ratios. It has tested to be highly predictive for identifying the best (most undervalued) and worst (most overvalued) sectors, with a 1-3 month forward look.
Bull Score and Bear Score are based on the price behavior of the underlying stocks on particularly strong and weak days during the prior 40 market days. They reflect investor sentiment toward the stocks (on a relative basis) as either aggressive plays or safe havens. So, a high Bull score indicates that stocks within the ETF have tended recently toward relative outperformance during particularly strong market periods, while a high Bear score indicates that stocks within the ETF have tended to hold up relatively well during particularly weak market periods.
Thus, ETFs with high Bull scores generally perform better when the market is hot, ETFs with high Bear scores generally perform better when the market is weak, and ETFs with high Outlook scores generally perform well over time in various market conditions.
Of course, each ETF has a unique set of constituent stocks, so the sectors represented will score differently depending upon which set of ETFs is used. For Sector Detector, I use ten iShares ETFs representing the major U.S. business sectors.
About Trading Strategies: There are various ways to trade these rankings. First, you might run a sector rotation strategy in which you buy long the top 2-4 ETFs from SectorCast-ETF, rebalancing either on a fixed schedule (e.g., monthly or quarterly) or when the rankings change significantly. Another alternative is to enhance a position in the SPDR Trust exchange-traded fund (SPY) depending upon your market bias. If you are bullish on the broad market, you can go long the SPY and enhance it with additional long positions in the top-ranked sector ETFs. Conversely, if you are bearish and short (or buy puts on) the SPY, you could also consider shorting the two lowest-ranked sector ETFs to enhance your short bias.
However, if you prefer not to bet on market direction, you could try a market-neutral, long/short trade—that is, go long (or buy call options on) the top-ranked ETFs and short (or buy put options on) the lowest-ranked ETFs. And here’s a more aggressive strategy to consider: You might trade some of the highest and lowest ranked stocks from within those top and bottom-ranked ETFs.