Sector Detector: Bulls seek new blood to boost conviction
 Last week, the Dow and S&P 500 large caps hit five-year highs, the Russell 2000 small caps and the S&P 400 mid-caps made all-time highs, and the Nasdaq recorded a 12-year closing high. But some investors are evidently showing concern that it has all come too far too fast. It didn’t help when the FOMC minutes (in which there was a whiff of a suggestion that the bond-buying program might be scaled back sooner than planned) were released on Wednesday mid-day and threw a wet blanket on the market’s early attempt to gather steam and push solidly above this current level of consolidation.
Nevertheless, the technical picture remains strong overall, and Sabrient's fundamentals-based SectorCast rankings remain bullish. It appears bulls are just taking their time gathering confidence and conviction—and perhaps some new blood—to forge ahead.
The new blood includes retail investors. In fact, there is growing evidence that individuals are starting to get back into the equities game as trading volumes at discount brokers are increasing and mutual fund inflows are picking up. This is also driven by the highly-correlated “risk-on/risk-off” theme apparently giving way to more of a lower-correlation stock-picker’s market. Another source of bullish fuel is short-covering as those betting on a significant pullback from these multi-year highs are being forced to buy.
Valuations are still attractive. It has been over five years since the S&P 500 was last above 1500, but stock and housing values are much lower. On a forward basis, the S&P 500 is currently trading at about 14x this year’s expected earnings-per-share compared with 20x in 2007 and a 30-year average closer to 16x. S&P Capital IQ reported in their latest “Lookout Report” that about 66% of the 400 companies that have reported have beat Wall Street estimates (compared with 33% in recent years and the historical average of 62%), with an annual earnings growth rate of nearly 7% and a record-setting EPS of $26.13. Technology and Financial companies have led the way in the earnings beats.
It all sounds quite impressive. But because the corporate earnings bar was set so low, growth is in no way overheated. So there is still plenty of room to improve...and carry stocks along with it.
Among those beating estimates this week was Express Scripts (ESRX), which is one of Sabrient’s “Baker’s Dozen” top stocks for 2013, Last year’s annual Baker’s Dozen portfolio was up +43%, and the prior 3 years (2009-2011) were up +35.5%, +21.3%, and +7.3%, smashing the S&P 500 returns each year. This year’s portfolio is off to a great start already, led by double-digit gains in Marathon Petroleum (MPC), Air Lease (AL), Manitowoc (MTW), and NXP Semiconductor (NXPI). Here’s a WSJ article about it:
http://www.sabrientsystems.com/WSJ-daily-transcript-bakers-dozen
With ultra-low borrowing rates spurring companies into new bond offerings, corporate America has accumulated plenty of cash to acquire other companies or buy back their own shares, and indeed M&A activity has been vibrant. Warren Buffett and 3G bought H.J. Heinz (HNZ) for $28 billion. Liberty Global (LBTYK) wants to buy Virgin Media (VMED) for $16 billion. Earlier this month, Dell Inc (DELL) announced it was going private in a $30 billion leveraged buyout. Office Depot (ODP) is in advanced talks with OfficeMax (OMX) for a $1.2 billion merger. AMR Corp (AAMRQ) and US Airways (LCC) intend an $11 billion merger. Notably, some financial firms publish lists of potential takeover targets. For example, Morningstar has identified Leap Wireless (LEAP), Chesapeake Energy (CHK), and Kohl's Corp (KSS). Buyouts and buybacks should continue to provide a bullish spark to the market.
The S&P500 SPDR Trust (SPY) closed Wednesday at 151.34 after hitting a new 52-week high of 153.28 on Tuesday. Oscillators RSI, MACD, and Slow Stochastic are all pointing down from overbought territory. There appears to be a narrow rising channel in place from the top of the gap on the first day of the New Year, and Wednesday’s closing price puts SPY right at the convergence of the bottom of the channel and the line of recent support. Next strong support should come in at 150, but I fully expect that level will be bought. Lower levels of strong support are shown on the chart, including the rising 50- and 100-day simple moving averages.
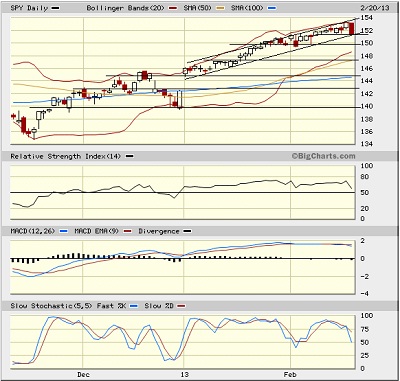
After prowling around its recent lows near 12 this week, the CBOE Market Volatility Index (VIX), a.k.a. “fear gauge,” closed Wednesday at 14.68, which was up 19% on the day. Still, VIX remains below 15, which is inordinately low, and seems to be artificially suppressed.
It remains to be seen whether we get a larger pullback that tests some support levels, but in any case, bulls are in charge and equities remain well-positioned to attract investors. I still fully expect the S&P 500 to ultimately challenge its all-time closing high of 1565. Sure, there are still lots of bogeymen and storm clouds out there, but if you wait until the skies are blue and advisors are unanimously giving us the all-clear sign to invest in equities, it will be too late.
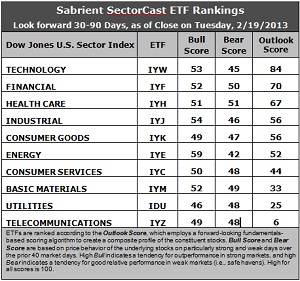
Latest rankings: The table ranks each of the ten U.S. industrial sector iShares ETFs by Sabrient's proprietary Outlook Score, which employs a forward-looking, fundamentals-based, quantitative algorithm to create a bottom-up composite profile of the constituent stocks within the ETF. The multi-factor model considers forward valuation, historical earnings trends, earnings growth prospects, the dynamics of Wall Street analysts' consensus estimates, accounting practices and earnings quality, and various return ratios. In addition, the table also shows Sabrient's proprietary Bull Score and Bear Score for each ETF.
High Bull score indicates that stocks within the ETF have tended recently toward relative outperformance during particularly strong market periods, while a high Bear score indicates that stocks within the ETF have tended to hold up relatively well during particularly weak market periods. Bull and Bear are backward-looking indicators of recent sentiment trend.
As a group, these three scores can be quite helpful for positioning a portfolio for a given set of anticipated market conditions.
Observations:
1. Technology (IYW) solidified its hold on the top spot with a robust score of 84, while Financial (IYF) stays second place with a slightly lower score of 70 in its weekly battle with Healthcare (IYH). These three continue to control the top of the sector rankings. IYW enjoys the lowest forward P/E, while IYF is a close second. Stocks within IYW also show strong projected growth, the best return ratios, and improving support from Wall Street analysts, while stocks within IYF have enjoyed the most upgrades from Wall Street.
2. Telecom (IYZ) stays in the cellar with an Outlook score of 6. It has poor support among Wall Street analysts, the worst return ratios, and the highest (worst) forward P/E. It is again joined in the bottom two this week by Utilities (IDU) with a score of 25.
3. Overall, this week’s rankings are very similar to last week’s moderately bullish list, but actually might have taken another small step to the bullish side as six of the ten sectors are now scoring above 50 in their Outlook scores (as opposed to only four last week). Also, the top-bottom spread of 78 is quite wide (compared with 66), reflecting greater conviction.
4. Looking at the Bull scores, Energy (IYE) is again the leader on strong market days, scoring 59, while defensive sector Utilities (IDU) is the laggard on strong market days, scoring 46.
5. Looking at the Bear scores, Healthcare (IYH) is serving as the favorite “safe haven” on weak market days, scoring 51, while Energy (IYE) is the worst during market weakness, as reflected in its low Bear score of 42. Two sectors are now scoring at or above 50, which is a positive development.
6. Overall, Technology (IYW) shows the best all-weather combination of Outlook/Bull/Bear scores. Adding up the three scores gives a total of 182. Telecom (IYZ) is by far the worst at 103. Looking at just the Bull/Bear combination, Financial (IYF) and Healthcare (IYH) share the best score at 102, followed by Materials (IYM) and Energy (IYE) at 101. Utilities (IDU) displays the lowest at 94. This indicates that Financial and Healthcare stocks have tended to perform the best in all market conditions.
These scores represent the view that the Technology and Financial sectors may be relatively undervalued overall, while Telecom and Utilities sectors may be relatively overvalued based on our 1-3 month forward look.
Top-ranked stocks within IYW and IYF include Apple Inc (AAPL), Tech Data Corp (TECD), Everest Re Group (RE), and Visa Inc (V).
Disclosure: Author has no positions in stocks or ETFs mentioned.
About SectorCast: Rankings are based on Sabrient’s SectorCast model, which builds a composite profile of each equity ETF based on bottom-up aggregate scoring of the constituent stocks. The Outlook Score employs a fundamentals-based multi-factor approach considering forward valuation, earnings growth prospects, Wall Street analysts’ consensus revisions, accounting practices, and various return ratios. It has tested to be highly predictive for identifying the best (most undervalued) and worst (most overvalued) sectors, with a 1-3 month forward look.
Bull Score and Bear Score are based on the price behavior of the underlying stocks on particularly strong and weak days during the prior 40 market days. They reflect investor sentiment toward the stocks (on a relative basis) as either aggressive plays or safe havens. So, a high Bull score indicates that stocks within the ETF have tended recently toward relative outperformance during particularly strong market periods, while a high Bear score indicates that stocks within the ETF have tended to hold up relatively well during particularly weak market periods.
Thus, ETFs with high Bull scores generally perform better when the market is hot, ETFs with high Bear scores generally perform better when the market is weak, and ETFs with high Outlook scores generally perform well over time in various market conditions.
Of course, each ETF has a unique set of constituent stocks, so the sectors represented will score differently depending upon which set of ETFs is used. For Sector Detector, I use ten iShares ETFs representing the major U.S. business sectors.
About Trading Strategies: There are various ways to trade these rankings. First, you might run a sector rotation strategy in which you buy long the top 2-4 ETFs from SectorCast-ETF, rebalancing either on a fixed schedule (e.g., monthly or quarterly) or when the rankings change significantly. Another alternative is to enhance a position in the SPDR Trust exchange-traded fund (SPY) depending upon your market bias. If you are bullish on the broad market, you can go long the SPY and enhance it with additional long positions in the top-ranked sector ETFs. Conversely, if you are bearish and short (or buy puts on) the SPY, you could also consider shorting the two lowest-ranked sector ETFs to enhance your short bias.
However, if you prefer not to bet on market direction, you could try a market-neutral, long/short trade—that is, go long (or buy call options on) the top-ranked ETFs and short (or buy put options on) the lowest-ranked ETFs. And here’s a more aggressive strategy to consider: You might trade some of the highest and lowest ranked stocks from within those top and bottom-ranked ETFs.