Sector Detector: Bulls resist giving up any ground
Earnings reports on Wednesday from big banks like Goldman Sachs ( GS) and JPMorgan Chase (JPM) were encouraging. And Apple (AAPL) got a much-needed boost from the top tech analysts. However, Goldman’s analysts tried to throw a wet blanket on the markets earlier this week with their expectation that earnings reports overall this year would be “uninspiring” and that equity returns this year likely will be only in the single digits. But I take that as something of a contrarian indicator.
On a forward basis, the S&P 500 forward P/E is only about 13, whereas the historical P/E average is around 15.5, which suggests that investors are skeptical that earnings expectations will be met. Many of the biggest companies like Apple, Cisco (CSCO), and Freeport McMoRan (FCX) have forward P/Es below 10.
This pervasive pessimism in the face of a climbing market is historically bullish. And in my book, U.S. equities still look well positioned for 2013, despite the potential for volatility around the Federal budget and debt ceiling debates. I still see reasonable stock valuations, record corporate earnings, high levels of cash in corporate coffers, and an accommodative Fed.
The wild card continues to be the future of debt and spending in this country. The Administration, Senate, and House have all vowed to give no ground. Yes, the amazing hypocrisy of our elected officials is in full plumage now. For example, back in 2003, Democrats bitterly opposed the Bush-era tax cuts, but this year they bitterly fought to protect the Bush-era tax cuts (except for the “rich,” of course). And back in 2006 when President Obama was but a junior senator, he railed against the idea of mortgaging our future by raising the debt ceiling, but of course now that he is in charge, he has continually pushed to raise the debt ceiling so as to perpetuate runaway entitlements, with no regard to the longer term consequences. But Republicans are no better; they adamantly supported raising the debt ceiling when Bush was president.
Looking beyond our shores, emerging markets also appear strong. Take a look at markets in Malaysia or Turkey or Mexico. But Ian Bremmer, president of political risk firm Eurasia Group, said this week that emerging markets will be particularly risky this year as the level of political instability is “underpriced,” especially in China. Some market observers are saying that Europe looks the best of all markets, with ultra-low valuations. ECB President Mario Draghi said last week that Eurozone financial markets have stabilized, with bond spreads tightening against German Bunds. To paraphrase Mark Twain, it turns out the reports of Europe’s death were greatly exaggerated.
The Sabrient “Baker’s Dozen” Top Stocks list for 2013 was released on January 11. In addition, a Unit Investment Trust for the same 13 high-potential GARP stocks—the Sabrient Baker’s Dozen 2013, issued by First Trust Portfolios L.P.—was launched. Last year’s portfolio gained an astounding +43%, and in fact each of the past four annual portfolios has crushed the market since inception in January 2009. This year’s portfolio is already off to a fine start, led by our top pick Genworth Financial (GNW), which was up nearly 9% on Wednesday alone.
You might already know that Sabrient is an index provider for a variety of ETFs, including Guggenheim Defensive Equity (DEF), Guggenheim Insider Sentiment (NFO), Direxion Multi-Cap Insider Sentiment (KNOW), iShares Balanced Income CorePortfolio (CBD.TO), and iShares Balanced Growth CorePortfolio (CBN.TO). So, I like to follow the ETF money flows. Last week, $22 billion flowed into equity mutual funds and exchange traded funds (ETF), which was the most since September of 2007. Nicolas Colas of ConvergEx thinks inflows could reach $200 billion in 2013, according to IndexUniverse. Moreover, IU reports that more than half of all U.S.-listed ETFs hold less than $100M AUM, and most of those hold less than $25M. So, although we will continue to see ETF closings and consolidations of the smaller and more thinly-traded funds, the future is bright for ETFs.
The S&P 500 SPDR Trust (SPY) closed Wednesday at 147.05 as it consolidates a quick burst within this band of strong triple-top resistance between 146 and 148. Buyers have been coming in on every intraday dip as the bulls recruit support to continue their gradual assault on the highs. Oscillators RSI, MACD, and Slow Stochastic remain quite overbought as bulls refuse to give up much ground, so perhaps a partial retracement of the breakaway gap from January 2 will come.
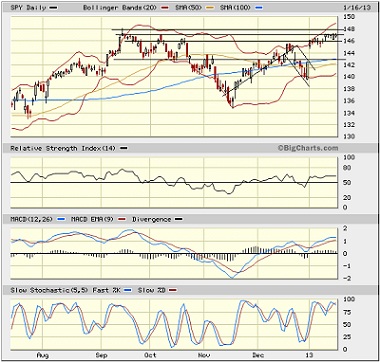
The CBOE Market Volatility Index (VIX), a.k.a. “fear gauge,” closed Wednesday at 13.42 after making a new 52-week low intraday. The mixed message remains that fear is low, which is bullish for stocks, but an overdue bounce would send stocks lower, at least temporarily.
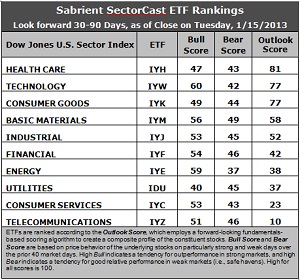
Latest rankings: The table ranks each of the ten U.S. industrial sector iShares (ETFs) by Sabrient's proprietary Outlook Score, which employs a forward-looking, fundamentals-based, quantitative algorithm to create a bottom-up composite profile of the constituent stocks within the ETF. The multi-factor model considers forward valuation, historical earnings trends, earnings growth prospects, the dynamics of Wall Street analysts' consensus estimates, accounting practices and earnings quality, and various return ratios. In addition, the table also shows Sabrient's proprietary Bull Score and Bear Score for each ETF.
High Bull score indicates that stocks within the ETF have tended recently toward relative outperformance during particularly strong market periods, while a high Bear score indicates that stocks within the ETF have tended to hold up relatively well during particularly weak market periods. Bull and Bear are backward-looking indicators of recent sentiment trend.
As a group, these three scores can be quite helpful for positioning a portfolio for a given set of anticipated market conditions.
Observations:
1. Healthcare (IYH) has taken back the top spot with a score of 81, while Technology (IYW) has fallen into a tie with Consumer Goods (IYK), each with an Outlook score of 77. IYH shows relatively good support among analysts and solid return ratios, while Technology (IYW) shows strong projected growth and a low forward P/E, as well as solid return ratios. Consumer Goods (IYK) shows the most analyst support and strong return ratios. Notably, in fourth place is Basic Materials (IYM) as the analysts are gradually coming back in support of the sector and its forward P/E is looking pretty good.
2. Telecom (IYZ) stays in the cellar with an Outlook score of 10, and is again joined in the bottom two this week by Consumer Services (IYC) with a 23. Stocks within IYZ appear overvalued from the standpoint of the forward P/E and lack analyst support.
3. This week’s rankings are mostly neutral, given the high scores for defensive sectors Healthcare and Consumer Goods, but with strength in Tech, Materials, and Industrial, which all score above 50. The bullish trend that seemed to get started last week from the prior defensive rankings has kind of stalled at this point.
4. Looking at the Bull scores, Technology (IYW) is the leader on strong market days, scoring 60. Utilities (IDU) is the laggard on strong market days, scoring 40. In other words, Tech stocks have tended to perform the best when the market is rallying, while Utilities stocks have lagged.
5. Looking at the Bear scores, none of the sectors are scoring very high. In fact, none score above 50! Utilities (IDU) is normally the favorite safe haven on weak market days, but it’s only scoring 45, which indicates that most everything is selling off equally during recent market weakness. Amazingly, Basic Materials (IYM), which is normally among the worst on weak days, is scoring the highest at 49. Energy (IYE) is the worst during market weakness, as reflected in its low Bear score of 37, but there’s only a 12-point range from top to bottom. Thus, Energy stocks have been selling off the most when the market is pulling back, while Materials stocks have held up the best, relatively speaking.
6. Overall, Technology (IYW) shows the best all-weather combination of Outlook/Bull/Bear scores. Adding up the three scores gives a total of 179. Telecom (IYZ) is by far the worst at 107. Looking at just the Bull/Bear combination, Healthcare (IYH), although displaying the best Outlook score, doesn’t look very good at all—with a total score of only 90. Utilities (IDU) is the lowest at 85. Basic Materials (IYM) has the best score at 105.
These scores represent the view that the Healthcare and Technology sectors may be relatively undervalued overall, while Telecom and Consumer Services sectors may be relatively overvalued based on our 1-3 month forward look.
Top-ranked stocks within IYH and IYW include DaVita HealthCare Partners (DVA), The Cooper Companies (COO), Cognizant Technology Solutions (CTSH), and Gartner Inc (IT).
Disclosure: Author has no positions in stocks or ETFs mentioned.
About SectorCast: Rankings are based on Sabrient’s SectorCast model, which builds a composite profile of each equity ETF based on bottom-up aggregate scoring of the constituent stocks. The Outlook Score employs a fundamentals-based multi-factor approach considering forward valuation, earnings growth prospects, Wall Street analysts’ consensus revisions, accounting practices, and various return ratios. It has tested to be highly predictive for identifying the best (most undervalued) and worst (most overvalued) sectors, with a 1-3 month forward look.
Bull Score and Bear Score are based on the price behavior of the underlying stocks on particularly strong and weak days during the prior 40 market days. They reflect investor sentiment toward the stocks (on a relative basis) as either aggressive plays or safe havens. So, a high Bull score indicates that stocks within the ETF have tended recently toward relative outperformance during particularly strong market periods, while a high Bear score indicates that stocks within the ETF have tended to hold up relatively well during particularly weak market periods.
Thus, ETFs with high Bull scores generally perform better when the market is hot, ETFs with high Bear scores generally perform better when the market is weak, and ETFs with high Outlook scores generally perform well over time in various market conditions.
Of course, each ETF has a unique set of constituent stocks, so the sectors represented will score differently depending upon which set of ETFs is used. For Sector Detector, I use ten iShares ETFs representing the major U.S. business sectors.
About Trading Strategies: There are various ways to trade these rankings. First, you might run a sector rotation strategy in which you buy long the top 2-4 ETFs from SectorCast-ETF, rebalancing either on a fixed schedule (e.g., monthly or quarterly) or when the rankings change significantly. Another alternative is to enhance a position in the SPDR Trust exchange-traded fund (SPY) depending upon your market bias. If you are bullish on the broad market, you can go long the SPY and enhance it with additional long positions in the top-ranked sector ETFs. Conversely, if you are bearish and short (or buy puts on) the SPY, you could also consider shorting the two lowest-ranked sector ETFs to enhance your short bias.
However, if you prefer not to bet on market direction, you could try a market-neutral, long/short trade—that is, go long (or buy call options on) the top-ranked ETFs and short (or buy put options on) the lowest-ranked ETFs. And here’s a more aggressive strategy to consider: You might trade some of the highest and lowest ranked stocks from within those top and bottom-ranked ETFs.