Sector Detector: Bulls lose traction as skids get “Greeced”
 Markets attempted to rebound on Wednesday after two days of fear and loathing, but extreme weakness in Apple (AAPL) held back the Nasdaq and S&P 500 while the Dow was able to finish positive. Whether this is just a dead cat bounce remains to be seen. Without a doubt, this week has changed the technical picture from bullish to iffy.
After Apple’s disappointing earnings report on Tuesday after market close, Raymond James said that Apple is now shifting from its previous levels of “obscene” growth to "normal” annualized growth of about 20% for the next several quarters. On the other hand, Symantec (SYMC), Altera (ALTR), and Juniper Networks (JNPR) all reported strong results and were up big on Wednesday, as the Tech sector led in spite of Apple. Still, there is huge anticipation of an iPhone 5, iPad mini, and Apple TV later this year.
The main drag on stocks is once again Europe, with Greece the main culprit. The IMF voiced renewed concerns about Greece’s ability to service its debt. In addition, Spain and Italy each instituted various limitations on short-selling. All of this has served to send the PowerShares DB US Dollar Index Bullish Fund (UUP) to 52-week highs, which typically implies weakness in U.S. stocks and commodities. Nevertheless, the dollar remains in a longer-term downtrend, which should be encouraging for stock investors.
The Greek 10-year bond is again yielding nearly 28%. Spain’s 10-year bond yield has burst through resistance at 7% and has been making new highs near 7.5%, while Italy’s 10-year yield has pushed convincingly through 6% and now trades around 6.5%. European bank stocks were weak as a result.
In an interesting side note on Wednesday, the House approved a bill sponsored by Ron Paul to give Congress greater scrutiny over the Federal Reserve and to make their operations and monetary decisions more transparent. As you know, Paul blames the growth of government and the rising federal deficit on the Fed’s stimulus programs. A companion bill is being introduced in the Senate by his son Rand Paul.
The SPY closed Wednesday at 133.96, which is clinging to the breakout level of the prior bullish ascending triangle formation. Some of my readers have taken issue with my reading of the chart, suggesting that I am displaying a bullish bias. One reader insisted that SPY is in a crystal clear bear flag pattern during this bounce off the June lows, with extreme weakness to come. However, if you look back at my previous weekly articles, on May 30 I noted the fledgling formation of a bear flag, and then on June 6 I wrote that it was indeed confirmed but then quickly reversed as the 200-day simple moving average attracted buyers before price could reach the downside target. So, my view is that the bear flag pattern has been negated, and we are now in a rising channel that is likely a continuation pattern within the multi-year uptrend off the March 2009 V-bottom (fueled by a friendly Fed). Of course, I could be dead wrong.
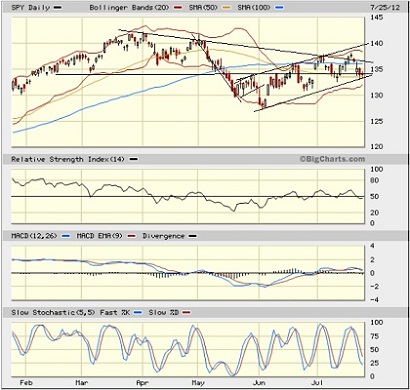
I have also drawn a neutral symmetrical triangle, with the lower side corresponding with the bottom of the rising channel. RSI and Slow Stochastic are both trying to turn back up, while MACD is basically treading water here. Some technicians say that MACD just issued a sell signal, but I don’t think it has confirmed quite yet (but could do so this week).
Nevertheless, the SPY chart has indeed moved from a strongly bullish appearance just last week to threatening a bearish reversal. SPY has been supported by its 50-day simple moving average all week. If this fails, next support is the bottom of the rising channel around 133 and then the 200-day SMA down near 131, which would be a do-or-die support level if it is tested again, as it was in early June.
The VIX (CBOE Market Volatility Index—a.k.a. “fear gauge”) closed Tuesday at 19.34. After a big 25% jump at the open on Monday to 20.44, it has been straddling the 20 level all week. This is an important level for the near-term direction of stocks.
Historically, the stock market usually rallies in the months preceding a Presidential election. All in all, I still think that buying the dips will prove profitable. But I am staying vigilant about those important support levels.
In any case, Sabrient subsidiary Gradient Analytics (in-depth forensic accounting research) has been helping its institutional clients make money on shorts or avoid meltdowns in longs. Many of its negatively-rated stocks have fallen hard this month, including: Chipotle Mexican Grill (CMG), Hittite Microwave (HITT), Power Integrations (POWI), International Rectifier (IRF), Mead Johnson Nutrition (MJN), Woodward (WWD), Cepheid (CPHD), Gentex (GNTX), Wipro (WIT), and Netflix (NFLX). And of the relatively few positively-rated stocks, Six Flags Entertainment (SIX) and Tempur-Pedic (TPX) are up nicely this week.
By the way, the next edition of The MacroReport will be released imminently, focusing this time on Central Banks. A co-publication of Sabrient Systems and MacroRisk Analytics, The MacroReport provides in-depth analysis of the macroeconomic trends in focus regions and how they might impact the U.S., with specific actionable ideas. Be sure to check it out, as well as MacroReport Interactive, which can help you position a portfolio for various macroeconomic scenarios, with lists of “Quick Response” U.S. stocks that tend to do well (as well as stocks to avoid) in a given macro-variable trend.
Visit: http://www.sabrient.com/macroreport/QuickResponse-Portfolios/overview.php
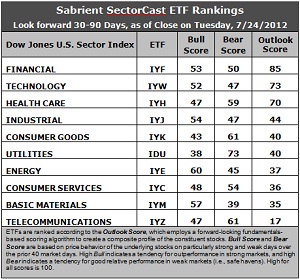
Latest rankings: The table ranks each of the ten U.S. industrial sector iShares (ETFs) by Sabrient’s proprietary Outlook Score, which employs a forward-looking, fundamentals-based, quantitative algorithm to create a bottom-up composite profile of the constituent stocks within the ETF. In addition, the table also shows Sabrient’s proprietary Bull Score and Bear Score for each ETF.
High Bull score indicates that stocks within the ETF have tended recently toward relative outperformance during particularly strong market periods, while a high Bear score indicates that stocks within the ETF have tended to hold up relatively well during particularly weak market periods. Bull and Bear are backward-looking indicators of recent sentiment trend.
As a group, these three scores can be quite helpful for positioning a portfolio for a given set of anticipated market conditions.
Observations:
1. There is a lot of shuffling in the rankings this week as earnings season is now in full swing. Wall Street’s revisions to earnings estimates have sent sectors like Consumer Services (IYC) and Materials (IYM) lower in the rankings while Energy (IYE) and Financial (IYF) moved higher. IYF is now in the top spot, jumping from last week’s Outlook score of 69 to 85 this week. Technology (IYW) falls to the second spot with an Outlook score of 73. Stocks within IYF are getting better analyst support and insider buying, and they have relatively low forward P/Es.
2. Healthcare (IYH) at 70 drops to third, and Industrial (IYJ) is now a distant fourth. These rankings are looking less bullish and more cautious, with defensive sectors Consumer Goods (IYK) and Utilities (IDU) rising in the rankings at the expense of IYW, IYC, and IYM.
3. Telecom (IYZ) remains at the bottom of the Outlook rankings this week with an Outlook score of 17, as it remains saddled with the highest (worst) forward P/E and the worst return ratios. Basic Materials (IYM) is now in the bottom two with a score of 35, but it is neck-and-neck with Consumer Services (IYC). Both lost analyst support.
4. Looking at the Bull scores, Energy (IYE) is the clear leader on strong market days, scoring 60. Materials (IYM) is close behind at 57. Utilities (IDU) is still by far the weakest on strong days, scoring 38. In other words, Materials and Energy stocks have tended to perform the best when the market is rallying, while Utilities stocks have lagged.
5. Looking at the Bear scores, Utilities (IDU) remains the strong investor favorite “safe haven” on weak market days, scoring 73. Telecom (IYZ) and Consumer Goods (IYK) are next highest at 61. Although Materials (IYM) is an investor favorite on strong market days, the sector has been abandoned (relatively speaking) by investors during market weakness, as reflected by its low Bear score of 39. In other words, Materials stocks have tended to sell off the most when the market is pulling back, while Utilities stocks have held up the best.
5. Overall, Financial (IYF) now shows the best all-weather combination of Outlook/Bull/Bear scores. Adding up the three scores gives a total of 188. IYZ is the worst at 125 due to its ultra-low Outlook score, but it has the best combination of Bull/Bear at 108. Materials (IYM) displays the worst combination of Bull/Bear with a 96.
These scores represent the view that the Financial and Technology sectors may be relatively undervalued overall, while Telecom and Materials sectors may be relatively overvalued, based on our 1-3 month forward look.
Top-ranked stocks within Financial and Technology sectors include CBOE Holdings (CBOE), CoBiz Financial (COBZ), Symantec (SYMC), and Western Digital (WDC).
Disclosure: Author has no positions in stocks or ETFs mentioned.
About SectorCast: Rankings are based on Sabrient’s SectorCast model, which builds a composite profile of each equity ETF based on bottom-up scoring of the constituent stocks. The Outlook Score employs a fundamentals-based multi-factor approach considering forward valuation, earnings growth prospects, Wall Street analysts’ consensus revisions, accounting practices, and various return ratios. It has tested to be highly predictive for identifying the best (most undervalued) and worst (most overvalued) sectors, with a one-month forward look.
Bull Score and Bear Score are based on the price behavior of the underlying stocks on particularly strong and weak days during the prior 40 market days. They reflect investor sentiment toward the stocks (on a relative basis) as either aggressive plays or safe havens. So, a high Bull score indicates that stocks within the ETF have tended recently toward relative outperformance during particularly strong market periods, while a high Bear score indicates that stocks within the ETF have tended to hold up relatively well during particularly weak market periods.
Thus, ETFs with high Bull scores generally perform better when the market is hot, ETFs with high Bear scores generally perform better when the market is weak, and ETFs with high Outlook scores generally perform well over time in various market conditions.
Of course, each ETF has a unique set of constituent stocks, so the sectors represented will score differently depending upon which set of ETFs is used. For Sector Detector, I use ten iShares ETFs representing the major U.S. business sectors.
About Trading Strategies: There are various ways to trade these rankings. First, you might run a sector rotation strategy in which you buy long the top 2-4 ETFs from SectorCast-ETF, rebalancing either on a fixed schedule (e.g., monthly or quarterly) or when the rankings change significantly. Another alternative is to enhance a position in the SPDR Trust exchange-traded fund (SPY) depending upon your market bias. If you are bullish on the broad market, you can go long the SPY and enhance it with additional long positions in the top-ranked sector ETFs. Conversely, if you are bearish and short (or buy puts on) the SPY, you could also consider shorting the two lowest-ranked sector ETFs to enhance your short bias.
However, if you prefer not to bet on market direction, you could try a market-neutral, long/short trade—that is, go long (or buy call options on) the top-ranked ETFs and short (or buy put options on) the lowest-ranked ETFs. And here’s a more aggressive strategy to consider: You might trade some of the highest and lowest ranked stocks from within those top and bottom-ranked ETFs, such as the ones I identify above.