Sector Detector: Bullish fundamental rankings at odds with bearish technicals
 Overall, the economy appears to be on a steady path to recovery. As the Federal Reserve eventually allows interest rates to rise, we likely will see a rotation out of value and into growth as defensive debt-intensive companies struggle relative to companies that have lower debt burden and stronger prospective earnings growth. However, that doesn’t mean that stocks will maintain the same low-volatility “all-boats-lifted-in-a-rising-tide” performance. And don’t forget the timeless “Sell in May and Go Away” adage that is on our doorstep.
The market is quite overdue for one of those scary selloffs -- not just the buyable entry-point pullbacks we’ve been seeing for so long -- and it just might become a self-fulfilling prophecy. In any case, with Fed tapering, volatility is widely expected to increase. As I discuss below, although the fundamentals-based rankings are more solidly bullish this week, the near-term technical picture has taken quite the bearish look.
Among the ten U.S. business sectors, defensive sector Utilities is up over +12% year to date and no one else is even close. The CBOE Market Volatility Index (VIX), a.k.a. “fear gauge,” closed last week at 14.06 and remains below the 15 threshold, indicating low investor trepidation about their stocks.
SPY chart review:
The SPDR S&P 500 Trust (SPY) closed Friday at 186.29, which is almost exactly where it finished the prior week. After rallying for most of the week, it gave it all back on Friday, and SPY has found temporary support at the convergence of its 20 and 40-day simple moving averages. Now price and oscillators like RSI, MACD, and Slow Stochastic are all rolling over. Although Friday’s weakness could be due simply to profit-taking and risk management ahead of another weekend during this time of instability in Ukraine, it also could be something more serious, as we could be looking at a head-and-shoulders top, as shown.
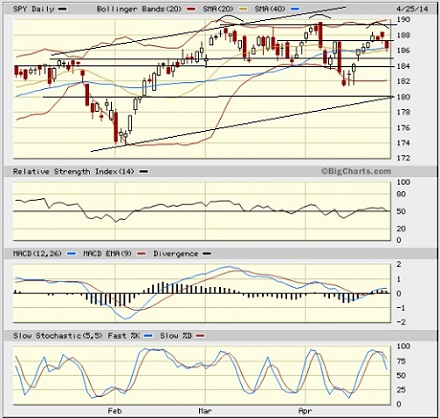
Even more disturbingly, if you look at a weekly (rather than daily) chart, there are bearish “shooting star” candlestick patterns with long upper shadows that support the notion of a broader topping pattern, and in fact last week’s candlestick looks like a dreaded “gravestone doji.” Notably, the NASDAQ, Russell 2000, and Dow Jones Industrials are all still negative year-to-date, while the S&P 500 is up less than 1%, and the NASDAQ and Russell 2000 were both solidly down for the week, and the 20,000 mark on the Wilshire 5000 continues to act as strong resistance.
Latest sector rankings:
Relative sector rankings are based on our proprietary SectorCast model, which builds a composite profile of each equity ETF based on bottom-up aggregate scoring of the constituent stocks. The “Outlook Score” employs a forward-looking, fundamentals-based multifactor algorithm considering forward valuation, historical and projected earnings growth, the dynamics of Wall Street analysts’ consensus earnings estimates and recent revisions (up or down), quality and sustainability of reported earnings (forensic accounting), and various return ratios. It helps us predict relative performance over the next 1-3 months.
In addition, SectorCast computes a “Bull Score” and “Bear Score” for each ETF based on recent price behavior of the constituent stocks on particularly strong and weak market days. High Bull score indicates that stocks within the ETF recently have tended toward relative outperformance when the market is strong, while a high Bear score indicates that stocks within the ETF have tended to hold up relatively well (“safe havens”) when the market is weak.
Outlook score is forward-looking while Bull and Bear are backward-looking. As a group, these three scores can be helpful for positioning a portfolio for a given set of anticipated market conditions. Of course, each ETF holds a unique portfolio of stocks and position weights, so the sectors represented will score differently depending upon which set of ETFs is used. We use the iShares that represent the ten major U.S. business sectors: Financial (IYF), Technology (IYW), Industrial (IYJ), Healthcare (IYH), Consumer Goods (IYK), Consumer Services (IYC), Energy (IYE), Basic Materials (IYM), Telecommunications (IYZ), and Utilities (IDU). Whereas the Select Sector SPDRs only contain stocks from the S&P 500, I prefer the iShares for their larger universe and broader diversity. Fidelity also offers a group of sector ETFs with an even larger number of constituents in each.
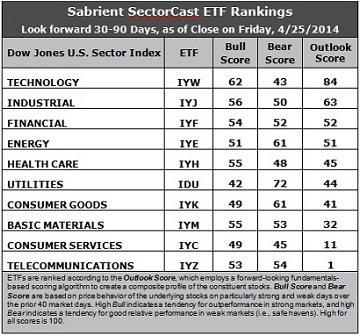
Here are some of my observations on this week’s scores:
1. There is a notably bullish transition this week. Technology remains in first place with a robust Outlook score of 84. Industrial moves into second place with a 63. Technology generally displays solid factor scores across the board, with a strong forward long-term growth rate, a reasonable forward P/E, the highest return ratios, and positive sentiment among Wall Street analysts (upward revisions to earnings estimates). Apple (AAPL), Facebook (FB), Texas Instruments (TXN), and Netflix (NFLX) all announced strong earnings last week and many sell-side analysts raised their estimates. Healthcare displays a good forward long-term growth rate, solid return ratios, and the strongest sentiment among sell-side analysts. Financial is in third at 52, with the lowest forward P/E, followed by Energy and Healthcare.
2. Telecom returns to the cellar with an Outlook score of 1, and it is joined in the bottom two by Consumer Services/Discretionary with a score of 11. Telecom displays generally low scores across the board.
3. Looking at the Bull scores, Technology has surged to a score of 62, while Utilities is by far the laggard with a low score of 42. The top-bottom spread has widened to 20 points, reflecting low sector correlations on particularly strong market days. It is generally desirable in a healthy market to see a top-bottom spread of at least 20 points, which indicates that investors have clear preferences in the stocks they want to hold, rather than the “all-boats-lifted-in-a-rising-tide” mentality that we saw during 2013.
4. Looking at the Bear scores, Utilities is the clear leader with a 72, which means that stocks within this defensive sector have been the preferred “safe havens” on weak market days. Technology scores the lowest at 43. The top-bottom spread is a robust 29 points, reflecting very low sector correlations on particularly weak market days. Again, it is generally desirable in a healthy market to see a top-bottom spread of at least 20 points.
5. Technology displays the best all-weather combination of Outlook/Bull/Bear scores, while Consumer Services is the worst. Looking at just the Bull/Bear combination, Utilities and Energy are the leaders, indicating superior relative performance (on average) in extreme market conditions (whether bullish or bearish), while Consumer Services scores by far the lowest, indicating general investor avoidance during extreme conditions.
6. Overall, I have to say that this week’s Outlook rankings look solidly bullish, with sectors displaying high Bull scores at the top, i.e., Technology, Industrial, and Financial. Meanwhile, defensive sectors Utilities and Consumer Goods have fallen into the bottom five.
These Outlook scores represent the view that Technology and Industrial sectors are relatively undervalued, while Consumer Services and Telecom may be relatively overvalued based on our 1-3 month forward look.
Stock and ETF Ideas:
Our Sector Rotation model, which appropriately weights Outlook, Bull, and Bear scores in accordance with the overall market’s prevailing trend (bullish, neutral, or bearish), suggests holding Technology, Industrial, and Financial in the prevailing bullish climate. (In this particular model, we consider the bias to be bullish from a rules-based standpoint because SPY is still above its 50-day simple moving average while also remaining above its 200-day SMA.)
Other ETFs that are ranked high by our algorithm from the Technology, Industrial, and Financial sectors include First Trust NASDAQ Technology Dividend Index Fund (TDIV), S&P SPDR Transportation ETF Trust (XTN), and PowerShares KBW Property & Casualty Insurance Portfolio (KBWP).
For an “enhanced” sector portfolio that enlists top-ranked stocks (instead of ETFs) from within Tech, Industrial, and Financial, some long ideas include Apple (AAPL), SanDisk (SNDK), TransDigm Group (TDG), L-3 Communications (LLL), Simon Property Group (SPG), and Signature Bank (SBNY). All are ranked highly in the Sabrient Ratings Algorithm and also score within the top quintile of our Earnings Quality Rank (EQR), which is a pure accounting-based risk assessment signal based on the forensic accounting expertise of our subsidiary Gradient Analytics. We have found EQR quite valuable for helping to avoid performance-offsetting meltdowns in our model portfolios.
However, if you are more comfortable with a neutral bias, the model suggests holding the same three: Technology, Industrial, and Financial. On the other hand, if you have a bearish outlook on the market, the model suggests holding Utilities, Energy, and Consumer Goods/Staples.
Disclosure: Author has no positions in stocks or ETFs mentioned.
Disclaimer: This newsletter is published solely for informational purposes and is not to be construed as advice or a recommendation to specific individuals. Individuals should take into account their personal financial circumstances in acting on any rankings or stock selections provided by Sabrient. Sabrient makes no representations that the techniques used in its rankings or selections will result in or guarantee profits in trading. Trading involves risk, including possible loss of principal and other losses, and past performance is no indication of future results.