Sector Detector: Bears trot out Cyprus in vain attempt to derail bulls
 Well, you gotta hand it to the bears; they are pulling out all stops in their effort to derail the bull train, just as the S&P 500 tries to eclipse its all-time high. This time they trotted out the tiny republic of Cyprus (pop. 1.1 million) and its battle with the EU over the terms of its financial bailout. Steal a big chunk of depositors’ accounts? Just the suggestion of it sent shockwaves around the world and threatened confidence not just in the euro but in the entire global banking system. Russia, with its massive (and largely illicit) individual bank deposits in the country, is not happy.
But the FOMC did its part to support bullish sentiment when it announced its decision to maintain the Fed Funds rate at 0.25% and continue its monthly asset purchase program. The statement cited improving economic conditions and inflation below target levels. It’s also notable that in the midst of a global currency war, the strengthening dollar since the first of February has not deterred equity bulls, which is a divergence from the inverse relationship we have grown to expect.
Also, with a debt ceiling confrontation and looming government shutdown at month end, the Senate approved legislation to lock in the sequester’s required spending cuts. Senate Minority Leader Mitch McConnell suggested that President Obama only becomes serious about tackling spending when Republicans use the debt ceiling to force him "kicking and screaming" into negotiations. Has anyone else noticed the coincidence that the $85 billion in mandated first-year cuts is the exact same number as the Fed’s monthly asset purchase program? Maybe Uncle Ben can simply print up an extra month’s worth of cash and give it to Obama so he doesn’t have to experience the trauma of trimming the rate of growth of Federal programs.
The Healthcare sector continues as the clear performance leader on a year-to-date basis among the ten U.S. sector iShares. But almost all sectors, with the notable exception of Telecom, are looking strong. In fact, Sabrient’s proprietary Bull Score shows a historically narrow top-bottom spread over recent weeks, which indicates high correlation (all boats lifted) on strongly bullish days.
Notably, ConvergEx reported in their recent monthly review of price correlations that there has been an 85% average sector correlation to the overall market. Stock-pickers and quant modelers would prefer lower equity correlations as it is generally characteristic of a healthy market to have lower correlations, rather than the risk-on/risk-off asset allocation trade.
Still, the technical picture remains strong, and Sabrient's fundamentals-based SectorCast rankings continue to display a slightly bullish bias overall.
Looking at the charts, the S&P500 SPDR Trust (SPY) closed Wednesday at 155.69, which is right where it was last Wednesday. This week, SPY again fell out of its narrow rising channel from the beginning of the year, bounced off support at 153, and now it is clinging to the bottom of the channel. The all-time high is still just above near 157. Oscillators RSI, MACD, and Slow Stochastic have all worked off some of their overbought conditions. Everything is in place here to power ahead.
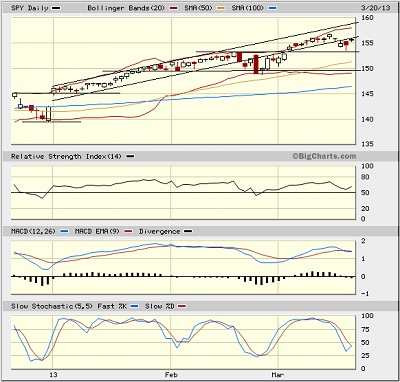
The CBOE Market Volatility Index (VIX), a.k.a. “fear gauge,” closed Wednesday at 12.67 after working off some oversold conditions and briefly threatening to move above 15. It remains extraordinarily low and supportive of equity bulls.
I still expect the S&P 500 to make a run soon at the all-time high of 1565 (and its intraday high of 1576) from October 2007. It came tantalizingly close last Friday when it hit 1563.62 intraday. Surely there were nervous traders who were quick on the trigger to cash in at the highs, but I expect most longer-term investors will hold on and entice traders to hold their positions a bit longer, too … unless the bears can trot out a stronger bogeyman than Cyprus. Beyond this resistance level are clear blue skies for the S&P, with only the Nasdaq facing historical resistance levels from over a decade ago.
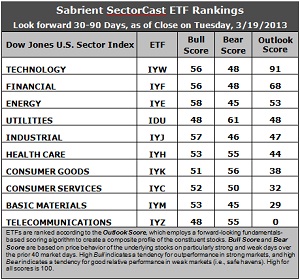
Latest rankings: The table ranks each of the ten U.S. industrial sector iShares ETFs by Sabrient's proprietary Outlook Score, which employs a forward-looking, fundamentals-based, quantitative algorithm to create a bottom-up composite profile of the constituent stocks within the ETF. The multi-factor model considers forward valuation, historical earnings trends, earnings growth prospects, the dynamics of Wall Street analysts' consensus estimates, accounting practices and earnings quality, and various return ratios. In addition, the table also shows Sabrient's proprietary Bull Score and Bear Score for each ETF.
High Bull score indicates that stocks within the ETF have tended recently toward relative outperformance during particularly strong market periods, while a high Bear score indicates that stocks within the ETF have tended to hold up relatively well during particularly weak market periods. Bull and Bear are backward-looking indicators of recent sentiment trend.
As a group, these three scores can be quite helpful for positioning a portfolio for a given set of anticipated market conditions.
Observations:
1. Technology (IYW) continues to sit firmly at the top, with a robust Outlook score of 91. Financial (IYF) remains in second place with a 68. IYW is strong across the board with a low forward P/E, solid support from Wall Street analysts, strong projected long-term growth, and the best return ratios. IYF also displays a low forward P/E and the best support (positive earnings revisions) from Wall Street, and has a reasonable projected long-term growth rate. Stocks within IYF also display the best insider sentiment (buying).
2. Telecom (IYZ) stays in the cellar with a rock-bottom Outlook score of 0 once again. It has the least support (negative earnings revisions) among Wall Street analysts, the worst return ratios, the highest (worst) forward P/E, a low projected long-term growth rate, and poor insider sentiment. It is joined in the bottom two this week by Basic Materials (IYM) with a score of 29, as Consumer Services (IYC) gained some Wall Street support to move it up. IYM is hindered by net downward analyst revisions and low projected long-term growth rate, although its forward P/E (valuation) is reasonable.
3. Overall, this week’s rankings appear maintain their slightly bullish bias, even with a little shuffling. Energy (IYE) and Consumer Services (IYC) have both risen in the rankings, while defensive sector Consumer Goods (IYK) fell on a rash of analyst net downward revisions. On the negative side, only three sectors are scoring above 50. But the wide top-bottom spread of 91 points theoretically reflects greater conviction.
4. Looking at the Bull scores, Energy (IYE) and Industrial (IYJ) are the leaders on particularly strong market days, scoring 58 and 57. Defensive sectors Utilities (IDU) and Telecom (IYZ) are the laggards on strong market days, scoring 48. The top-bottom spread is only 10 points, which continues to indicate high correlation on strongly bullish days, although slightly less so than last week.
5. Looking at the Bear scores, Utilities (IDU) is serving as the favorite “safe haven” on weak market days, scoring 61, followed by Consumer Goods (IYK) at 56. Basic Materials (IYM) and Energy (IYE) are the worst during market weakness as reflected in their low Bear scores of 45. The top-bottom spread is 16 points, which indicates lower correlations when the market is particularly weak.
6. Overall, Technology (IYW) shows the best all-weather combination of Outlook/Bull/Bear scores. Adding up the three scores gives a total of 195. Telecom (IYZ) is by far the worst at 103. Looking at just the Bull/Bear combination, defensive sector Utilities (IDU) remains at the top with a total score of 109, followed closely by Healthcare (IYH). Materials (IYM) displays the lowest score at 98. This indicates that Utilities stocks have tended to perform the best in extreme market conditions (whether bullish or bearish).
These Outlook scores represent the view that Technology and Financial sectors may be relatively undervalued, while Telecom and Basic Materials sectors may be relatively overvalued based on our 1-3 month forward look.
Top-ranked stocks within Technology and Financial include CommVault Systems (CVLT), Cree Inc (CREE), Franklin Resources (BEN), and Portfolio Recovery Associates (PRAA).
Disclosure: Author has no positions in stocks or ETFs mentioned.
About SectorCast: Rankings are based on Sabrient’s SectorCast model, which builds a composite profile of each equity ETF based on bottom-up aggregate scoring of the constituent stocks. The Outlook Score employs a fundamentals-based multi-factor approach considering forward valuation, earnings growth prospects, Wall Street analysts’ consensus revisions, accounting practices, and various return ratios. It has tested to be highly predictive for identifying the best (most undervalued) and worst (most overvalued) sectors, with a 1-3 month forward look.
Bull Score and Bear Score are based on the price behavior of the underlying stocks on particularly strong and weak days during the prior 40 market days. They reflect investor sentiment toward the stocks (on a relative basis) as either aggressive plays or safe havens. So, a high Bull score indicates that stocks within the ETF have tended recently toward relative outperformance during particularly strong market periods, while a high Bear score indicates that stocks within the ETF have tended to hold up relatively well during particularly weak market periods.
Thus, ETFs with high Bull scores generally perform better when the market is hot, ETFs with high Bear scores generally perform better when the market is weak, and ETFs with high Outlook scores generally perform well over time in various market conditions.
Of course, each ETF has a unique set of constituent stocks, so the sectors represented will score differently depending upon which set of ETFs is used. For Sector Detector, I use ten iShares ETFs representing the major U.S. business sectors.
About Trading Strategies: There are various ways to trade these rankings. First, you might run a sector rotation strategy in which you buy long the top 2-4 ETFs from SectorCast-ETF, rebalancing either on a fixed schedule (e.g., monthly or quarterly) or when the rankings change significantly. Another alternative is to enhance a position in the SPDR Trust exchange-traded fund (SPY) depending upon your market bias. If you are bullish on the broad market, you can go long the SPY and enhance it with additional long positions in the top-ranked sector ETFs. Conversely, if you are bearish and short (or buy puts on) the SPY, you could also consider shorting the two lowest-ranked sector ETFs to enhance your short bias.
However, if you prefer not to bet on market direction, you could try a market-neutral, long/short trade—that is, go long (or buy call options on) the top-ranked ETFs and short (or buy put options on) the lowest-ranked ETFs. And here’s a more aggressive strategy to consider: You might trade some of the highest and lowest ranked stocks from within those top and bottom-ranked ETFs.