Net Insider Transactions cycles back to selling

As I reported last month, January saw relatively limited insider trading in the wake of some year-end net profit-taking in December. So, it was encouraging to see the buyers return during February. Nevertheless, weekly net insider trading transactions (the number of individual buyers minus sellers) still finished February quite negatively, as a lot of insiders appeared to be selling into a resurgent market. Is it indicating some doubt about the sustainability of market strength? Let’s dig a bit deeper into the numbers.
Rather than look at the total dollars traded—which typically runs strongly to the sell side—at Sabrient we prefer to add up the number of unique insider buyers during the week minus the number of insider sellers, as reported to the SEC on Form 4 – open market transactions. In essence, we look at each buyer or seller as casting a “vote” on their company stock, which we have found can be insightful.
In our view, insiders sell for a lot of reasons besides simple fear of a sell-off, including diversification, retirement, college expenses, vacation homes, etc., so a few large sellers can skew the dollar totals. But they generally only buy on the open market for one reason—they think their stock is undervalued and should go up.
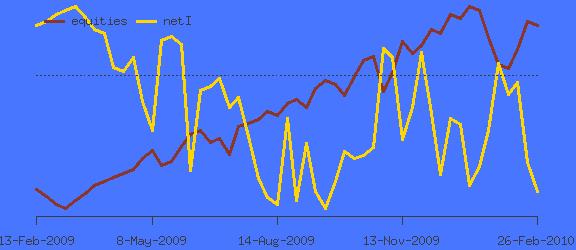
Let’s look at the chart below. The bright line indicates weekly net transactions and the dark line represents the overall market performance. After buying the March dip and then selling into the summer strength, weekly insider net transactions turned positive again in the autumn. Approaching year end, the sellers came out to take some chips off the table.
Again, Buys represent the number of open market insider transactions during the given week that increase an insider’s net holdings; while Sells are the number of open market insider transactions during the given week that decrease an insider’s net holdings. We are NOT measuring the dollar size of those transactions.
Over the past year, this metric was the most strongly positive during market weakness in March when it clocked in at 840 buyers vs. 189 sellers for a net +651. Since then, we’ve seen a low of -254 during September, an interim high of +47 during October, and then a net of -122 in mid December as insiders prepared to take off for the holidays. For the final week of the year, trading was light at 101 buyers vs. 165 sellers for a net of -64.
This month, I’m including a table of weekly transactions to show the numbers for the past two 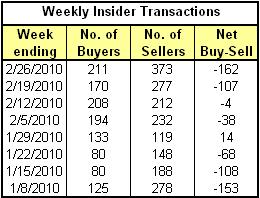 months. You can see that insider trading got even lighter the week of January 15 with only 80 buyers filing their transactions vs. 188 sellers. Although the total number of both buyers and sellers was way down, the four weeks of January actually saw steadily improving weekly net transactions.
Then as February closed, we find that the number of buyers was still quite strong, although they were outnumbered by sellers. For the entire month, there were 783 open market purchases and 1094 open market sales by insiders, with the final week of the month seeing 211 buyers and 373 sellers (net of -162).
Nevertheless, we know that insiders sell for many different reasons, and the 211 buyers was the highest number since mid-December. So, I wouldn’t surmise that insiders are giving up just yet. When they want to reduce their holdings, insiders tend to sell into strength. But if we get a bit of a market pullback during March, I wouldn’t be surprised to see insider buyers come out in even greater numbers.