Net Insider Trading loses direction

Last month, it appeared that net insider trading transactions (the number of individual buyers minus sellers) was breaking out to the upside. It was certainly acting as a leading indicator for the end-of-year rally. Updating this for the week ending December 31, it appears that insiders have been looking to sell into market strength. Is this an indication that insiders are losing confidence in their company stock to make much more upside from these levels?
One of the data items that Sabrient tracks is Net Insider Transactions. Rather than look at the total dollars traded--which has been strongly to the sell side--we prefer to add up the number of unique insider purchasers during the week minus the number of insider sellers, as reported to the SEC on Form 4 – open market transactions.
In our view, insiders sell for a lot of reasons other than fear of overvaluation, including diversification, retirement, college expenses, vacation homes, etc., so a few large sellers can skew the dollar totals. But they generally only buy on the open market for one reason — i.e., they think their stock is undervalued relative to growth prospects and should go up. We like to look at each buyer or seller as essentially casting a “vote” on their company stock, which can be quite meaningful.
Let’s look at the chart below. After buying the March dip and then selling into the summer strength, insider net transactions turned positive again when it became evident that the economy was making progress and the market rally was for real. More recently, buyers seem to have become nervous about the sustainability of the nearly monotonic rally, and the number of sellers increased.
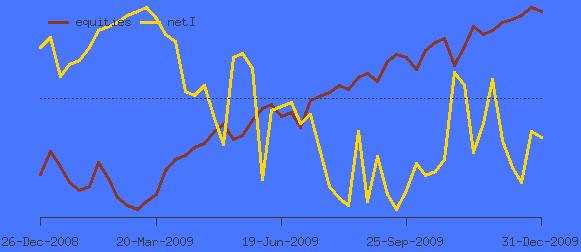
Again, Buys represent the number of open market insider transactions during the given week that increase an insider’s net holdings; while Sells are the number of open market insider transactions during the given week that decrease an insider’s net holdings. We are NOT measuring the dollar size of those transactions. (Note: The dark line shows the overall stock market performance.)
For the full year, this metric was the most strongly positive in the abyss of the week ending March 13 when it clocked in at 840 buyers vs. 189 sellers for a net +651. Since then, we’ve seen a low of -254 during September (143 buyers – 397 sellers), an interim high of +47 (198 buyers – 151 sellers) during October, and then a net of -122 (246 buyers – 368 sellers) in mid December as insiders prepared to take off for the holidays. For the final week of the year, trading was light at 101 buyers vs. 165 sellers for a net of -64. As you can see in the chart, the indicator is directionless at the moment (but I wouldn’t be surprised to see it go positive again).
Last month, I mentioned that although the market was somewhat extended on a technical basis, net insider transactions was serving as a positive sentiment indicator with respect to near-term market performance, and indeed the year finished quite strong. It will be interesting to see how insider trading develops during January.