Net Insider Trading goes positive again

After selling into year-end market strength to close out the year, net weekly net insider trading transactions (the number of individual buyers minus sellers) has finished January on a slightly positive note, as many insiders appear to have taken advantage of the market weakness to increase their net holdings.
One of the data items that Sabrient tracks is Net Insider Transactions. Rather than look at the total dollars traded—which continues to run strongly to the sell side—we prefer to add up the number of unique insider purchasers during the week minus the number of insider sellers, as reported to the SEC on Form 4 – open market transactions. In essence, we look at each buyer or seller as casting a “vote” on their company stock, which we have found can be quite meaningful.
In our view, insiders sell for a lot of reasons besides simple fear of a selloff, including diversification, retirement, college expenses, vacation homes, etc., so a few large sellers can skew the dollar totals. But they generally only buy on the open market for one reason—they think their stock is undervalued and should go up.
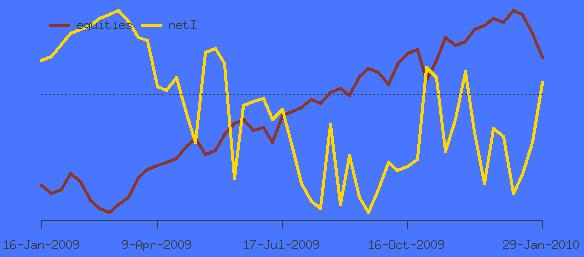
Let’s look at the chart below. The bright line indicates net transactions and the dark line represents the market performance. After buying the March dip and then selling into the summer strength, insider net transactions turned positive again in the autumn when it became evident that the economy was making progress and the market was on a roll. Then, as it approached year end, the sellers came out to take some chips off the table.
Again, Buys represent the number of open market insider transactions during the given week that increase an insider’s net holdings; while Sells are the number of open market insider transactions during the given week that decrease an insider’s net holdings. We are NOT measuring the dollar size of those transactions.
Over the past year, this metric was the most strongly positive in the abyss of the week ending March 13 when it clocked in at 840 buyers vs. 189 sellers for a net +651. Since then, we’ve seen a low of -254 during September (143 buyers – 397 sellers), an interim high of +47 (198 buyers – 151 sellers) during October, and then a net of -122 (246 buyers – 368 sellers) in mid December as insiders prepared to take off for the holidays. For the final week of the year, trading was light at 101 buyers vs. 165 sellers for a net of -64.
I said in last month’s review that I wouldn’t be surprised to see it go positive again, and in fact it has done just that.
Although the total number of both buyers and sellers has been way down, the four weeks of January saw steadily improving weekly net transactions of -153, -106, -68, and finally +15. Mid-January saw a paltry 81 buyers vs. 187 sellers (net of -106), but the last week of January saw 133 buyers vs. 118 sellers (net of +15).
This is but one slightly positive indicator among a sea of both positive and negative ones.